Christina Rambo, New Hampshire Department of Environmental Services, Concord, New Hampshire
Communities across New England, including New Hampshire, are experiencing increased flooding, drought, excessive heat, variable winters, and other extreme weather events that threaten the functionality of their critical infrastructure like water and wastewater systems. By the end of this century, it is projected that New Hampshire communities will experience an additional 50 or more days with temperatures above 90°F (32°C) compared to today. Additionally, annual precipitation is expected to increase by about 5.5 inches (in.) (13 centimeters (cm)) per year, a 12% increase.
To better understand the current and future impacts of extreme weather on critical infrastructure, our team conducted water and wastewater system vulnerability assessments for 14 communities across New Hampshire. The main advantages of such an assessment process are:
its ability to be scaled based on the user’s community,
its flexibility to adapt as new climate assets or systems data become available, and
its ability to allow the user to prioritize projects based on each asset’s identified vulnerability.
Through this effort, the New Hampshire Department of Environmental Services (NHDES) intends to support municipalities and utilities in identifying vulnerabilities within their water and wastewater infrastructure systems related to natural disasters and extreme weather events. With this understanding, utilities can work to minimize these vulnerabilities which, if not addressed, could not only prove costly to fix after an event but also put public health in jeopardy.
Vulnerability assessments are crucial for understanding how drinking water and wastewater treatment systems will be affected by changes in long term weather patterns and extreme weather events. Utilities across New Hampshire have already felt the impacts of flooding, extreme heat, drought, and other climate hazards which have disrupted the functions and operations of these essential services.
The purpose of our vulnerability assessment was to:
assess climate impacts on water and wastewater infrastructure,
develop conceptual strategies to increase resilience, and
prepare utilities to incorporate vulnerability assessment data into their asset management programs to prioritize projects and enhance system resilience.
Understanding an asset’s vulnerability to extreme weather is essential for strengthening decision-making around asset management, guiding capital investment planning, and ensuring compliance with new permit requirements. Such an assessment positions New Hampshire communities to meet emerging regulatory requirements, like those under the National Pollution Discharge Elimination System (NPDES) program, while proactively preparing for extreme weather over the coming century. The central goal is to advance understanding of how climate hazards affect water and wastewater systems and to translate that knowledge into actionable planning tools.
Findings are designed to integrate seamlessly into existing asset management systems, hazard mitigation plans, and standard operating procedures and support informed decisions that reduce risks to infrastructure and public health. By identifying vulnerable assets, a vulnerability assessment enables communities to prioritize funding, plan targeted adaptations, and anticipate when specific facilities may become increasingly at risk under future climate scenarios. In this way, a vulnerability assessment provides both a near-term decision-making framework and a long-term roadmap for building resilient utility systems.
Vulnerability Assessment
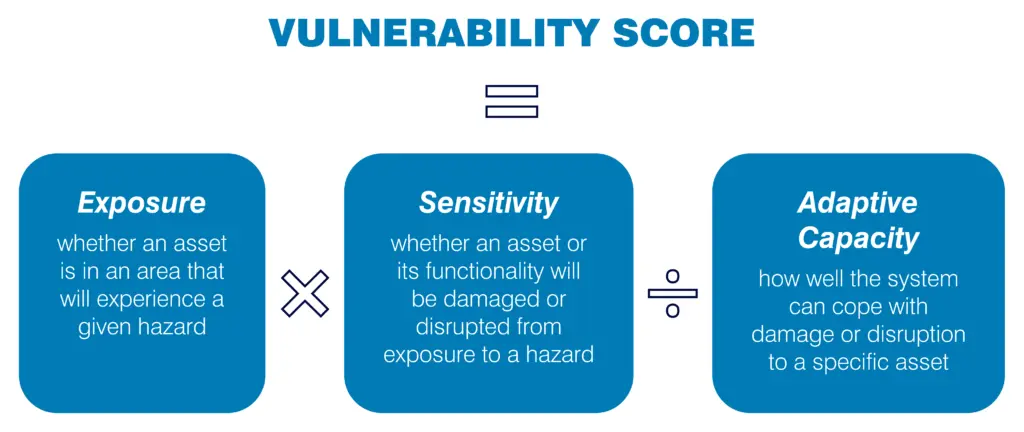
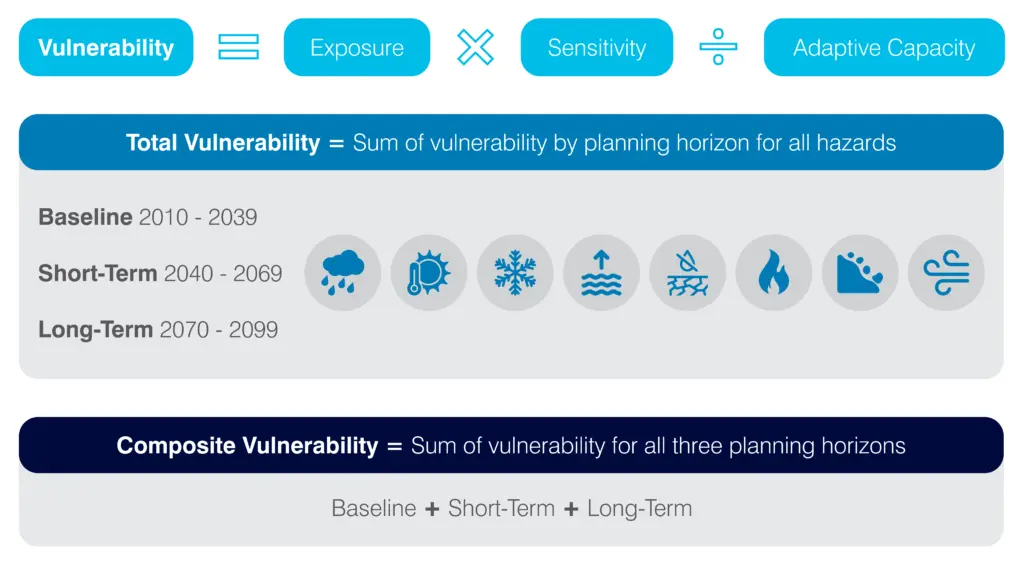
A vulnerability score (Figure 1) developed through the assessment process can be described as the degree to which a system is susceptible to adverse effects of extreme weather and is a function of three components:
exposure, or whether an asset is in an area that will experience a given hazard;
sensitivity, or whether an asset or its functionality will be damaged or disrupted from exposure to a hazard; and
adaptive capacity, or the ability of an asset to accommodate or recover from the impacts of climate hazards.
FIGURE 1. A vulnerability assessment’s “vulnerability score” is a function of three components: exposure, sensitivity, and adaptive capacity.
The climate hazards that our team assessed for the purpose of this vulnerability assessment included:
sea level rise/storm surge (coastal towns)
extreme precipitation (pluvial and fluvial)
extreme heat
winter weather
drought
wildfires
landslides
wind
We conducted vulnerability assessments using three planning horizons to identify changing climate conditions under the:
baseline (2010-2039),
short-term (2040-2069), and
long-term (2070-2099) planning horizons.
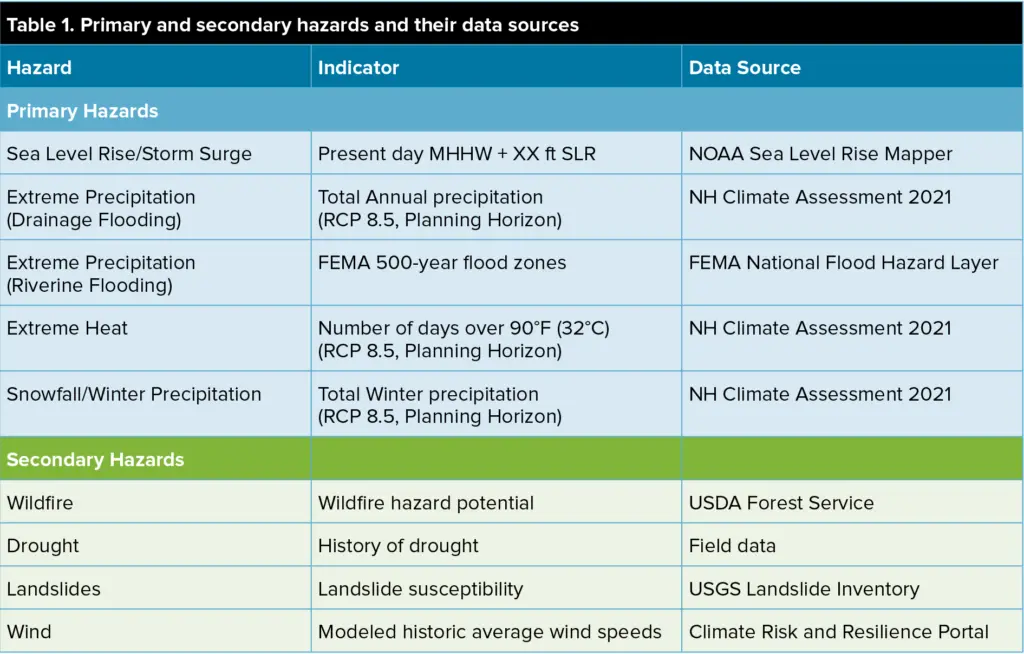
We categorized the climate hazards as primary or secondary based on the availability of high-quality future climate projection data, primarily from the New Hampshire Climate Assessment 20211 (Figure 2). The primary hazards included sea level rise/storm surge, extreme precipitation, extreme heat, and winter weather, with the remaining hazards considered secondary.
These hazards are central to determining exposure, sensitivity, and adaptive capacity and enabling the evaluation of both system-scale and asset-scale vulnerabilities to inform asset management and capital planning. They also help utilities meet new NPDES permit requirements for wastewater systems.
By addressing both scales of vulnerability, a vulnerability assessment not only provides asset-specific insights but also establishes broader system-level planning and coordination. The findings from a vulnerability assessment are intended to facilitate conversations and assessments in communities related to the vulnerability of water and wastewater systems to extreme weather.
Data Collection and Engagement
FIGURE 2. The team categorized climate hazards based on the availability of high-quality future climate projection data, primarily from the New Hampshire Climate Assessment (2021).
The vulnerability assessment process was initiated with site visits to the participating communities’ vertical assets associated with their water and wastewater systems. This was to gather information about the asset’s critical systems, condition, and surrounding area. We used ArcGIS Survey123 to geolocate asset data, which fed into the various elements of vulnerability assessment scoring.
The engagement with water and wastewater system operators was a critical component of understanding the functionality, vulnerabilities, and resilience of these essential infrastructure systems. Our site visits provided an opportunity to gain valuable institutional knowledge directly from operators who had long-term, first-hand experience managing their systems under varying conditions.
Through in-person discussions and site assessments, we gathered insights about system design, operational challenges, and past climate-related impacts. In addition to on-site discussions with system owners and operators, the vulnerability assessments also brought together participating communities to share experiences, inform methodology development, and provide practical context that strengthened the overall assessment.
Exposure Approach
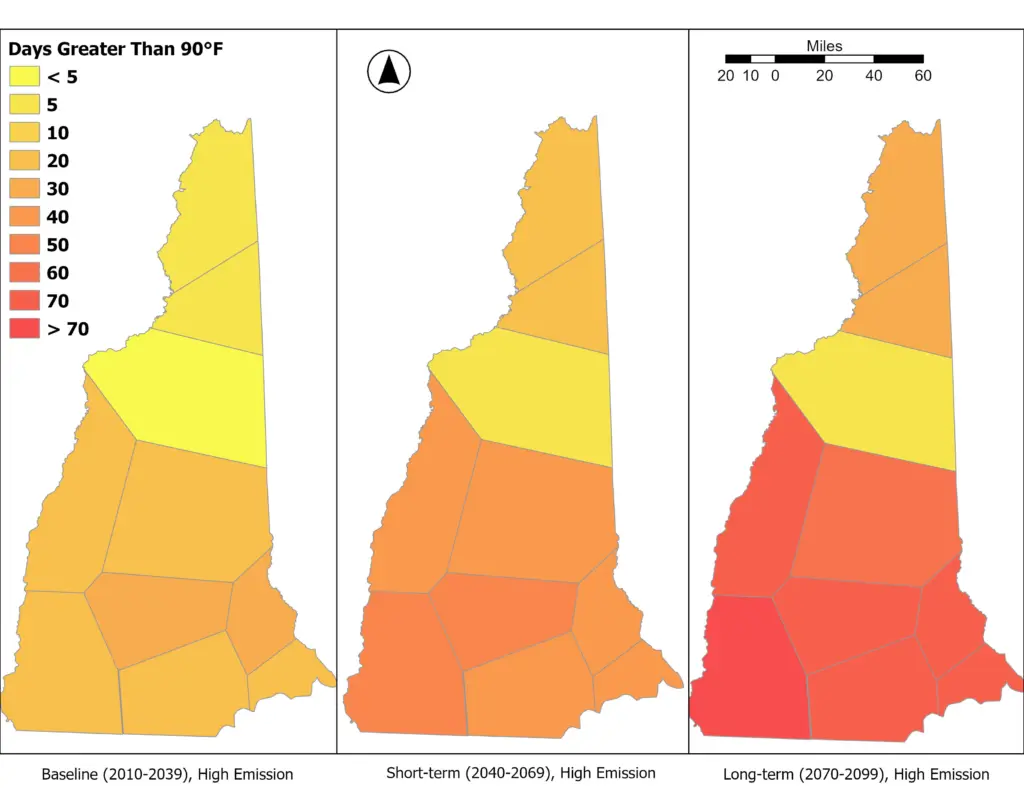
The exposure assessment considered how water and wastewater assets in one New Hampshire community could be affected by a range of hazards, both now and in the future. To capture how risks might change over time, the team used the three planning horizons mentioned earlier (baseline, short-term, and long-term) based on the New Hampshire Climate Assessment, which provides detailed projections from 10 weather stations across the state. We applied a geographic tool to extend these projections beyond the stations themselves, allowing communities without direct monitoring to still benefit from locally relevant estimates. This approach created a consistent statewide dataset that highlighted how conditions such as hotter days and heavier rainfall could vary by region.
The following maps in Figure 3 show temporal and spatial variations in days above 90°F under high emission scenarios across New Hampshire after extrapolating data from 10 weather stations using projections from the New Hampshire Climate Assessment.
FIGURE 3. Projected number of days with maximum temperature above 90°F (30°C) across New Hampshire extrapolated based on data from New Hampshire Climate Assessment (2021).
The exposure analysis looked at nine hazards in total as discussed earlier – five primary and four secondary hazards. For each hazard, the team used multiple indicators such as flood zone mapping, precipitation projections, or land cover to estimate how exposed each facility was under current and future conditions. Table 1 below shows some example indicators and their respective data sources used in the exposure analysis. Field data collected with ArcGIS Survey123 strengthened this analysis by capturing site-specific details. Each asset received exposure scores across the three planning horizons for primary hazards and a baseline score for secondary hazards.
TABLE 1. Primary and secondary hazards and their data sources.
Sensitivity Approach
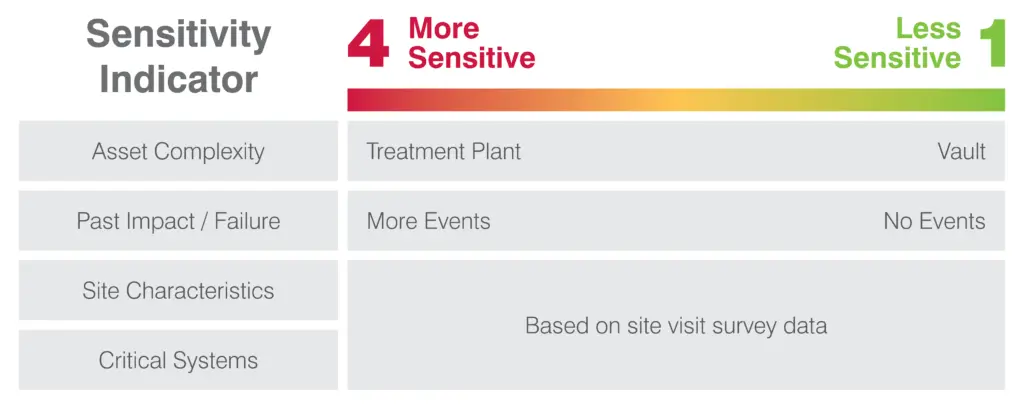
The inclusion of these indicators seeks to capture the range of impacts that exposure might have on an asset based on its characteristics. Complexity, history of extreme weather events, site layout, and other factors can all contribute to varying degrees of sensitivity. For example, when it came to indications related to site characteristics, we considered factors like:
Are there concerns about maintaining site access? (e.g., road conditions, possible falling trees, steep slopes, snow plowing, etc.)
Are there any road/stream crossings on site or nearby? (e.g., culvert, bridge, etc.)
Does grading slope toward the building or structure?
Each indicator was assigned a score ranging from 1 to 4 and these individual scores were then summed to produce a single sensitivity score. A higher total score indicates greater sensitivity of the asset, meaning it has more weak areas that could increase its vulnerability to extreme weather events.
FIGURE 4. Sensitivity indicators and respective scoring used to calculate sensitivity scoring.
Adaptive Capacity Approach
To understand the efforts that utilities have undertaken to date to adapt to the climate impacts they experience, our adaptative capacity framework included a series of indicators to understand redundancy, accessibility of necessary supplies, and hazard specific measures. Some of these indicators include questions like:
Is there a backup power supply?
Does the system have any redundancy?
Does the building have remote operations?
What is the storage capacity?
Does it have any existing flood or heat protection measures?
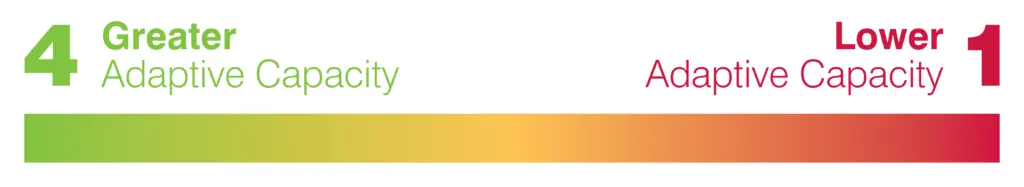
Adaptive capacity indicators also received scores ranging from 1 to 4, however, a higher adaptive capacity score represents a greater ability to respond to a climate hazard (Figure 4b), the opposite of sensitivity.
FIGURE 4b. Each indicator received a score on the scale of 1 to 4, with a score of 1 meaning lower adaptive capacity and 4 meaning greater adaptive capacity.
Vulnerability Results
Figure 5 illustrates how vulnerability scores are calculated by combining exposure and sensitivity and then adjusting for adaptive capacity. As mentioned earlier, each asset received scores across our three planning horizons for multiple hazards. The total vulnerability is the sum of scores for all hazards within a given horizon, while the composite vulnerability aggregates results across all three horizons to show how risks evolve over time.
FIGURE 5. The framework for calculating vulnerability scores.
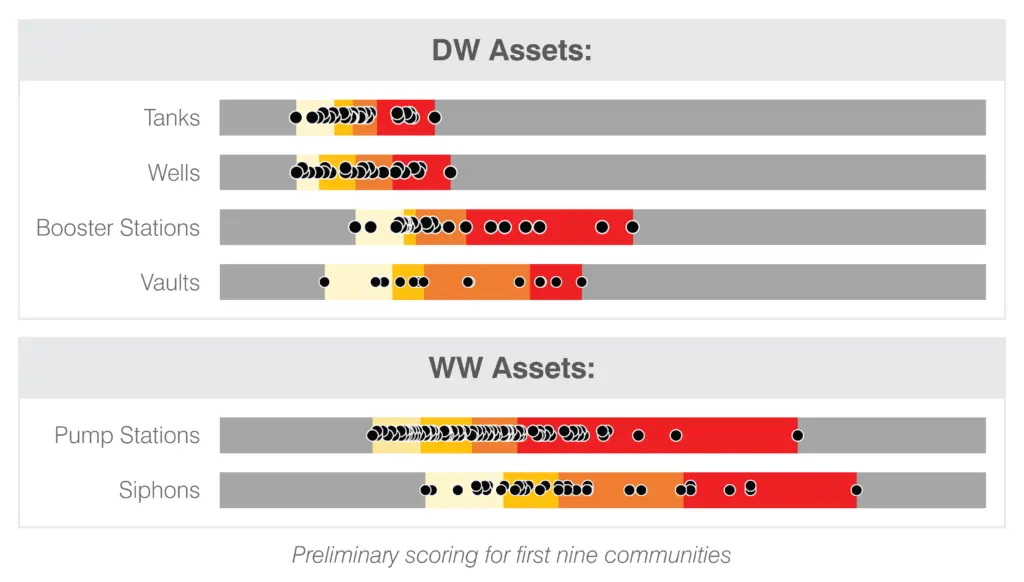
The vulnerability assessments revealed several important trends in how water and wastewater infrastructure are likely to be affected by a changing climate. The results demonstrate that vulnerability is not uniform across asset types, reflecting differences in design, function, and adaptive capacity (Figure 6) in multiple communities. Pump stations consistently demonstrated the widest spread of scores, with many clustered in the higher vulnerability ranges, underscoring their operational complexity and reliance on multiple critical systems.
FIGURE 6. Distribution of vulnerability scores across asset types, showing that the spread and magnitude of risk vary by infrastructure category.
In contrast, storage tanks and wells exhibited more moderate distributions, while booster stations and vaults showed narrower spreads but included several high-vulnerability outliers. These differences highlight that vulnerabilities are not evenly distributed within or across systems, reinforcing the need for asset-specific evaluation rather than generalized assumptions about system-wide risk.
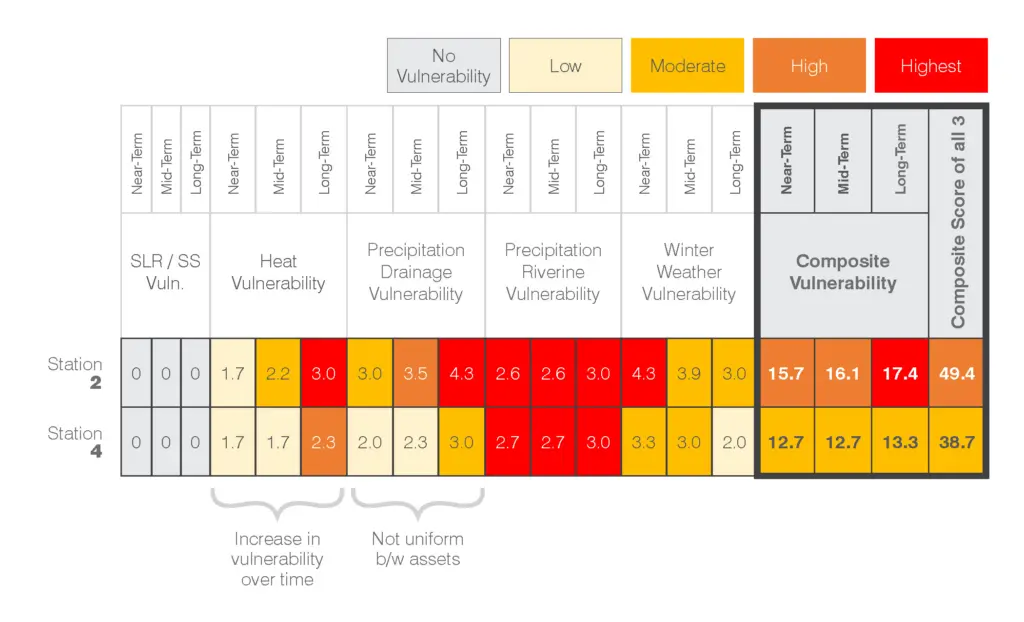
The results highlighted the role of temporal change in shaping vulnerability. Assets that may have only moderate vulnerability under current conditions are projected to face significantly higher risks by the mid and late terms.
For instance, in the following example (Figure 7), vulnerability to extreme heat and precipitation events increases steadily across the three planning horizons, with vulnerability scores reflecting both the intensification of climate hazards and the limitations of existing protective measures. Winter weather vulnerability showed a more variable pattern: while near-term risks remain high, some systems may experience a reduction in vulnerability later in the century as winters shift toward warmer and wetter conditions.
FIGURE 7. Vulnerability scores for two pump stations across hazards and planning horizons, showing an overall increase in vulnerability over time.
A Generational Shift: Preparing for the Future Workforce
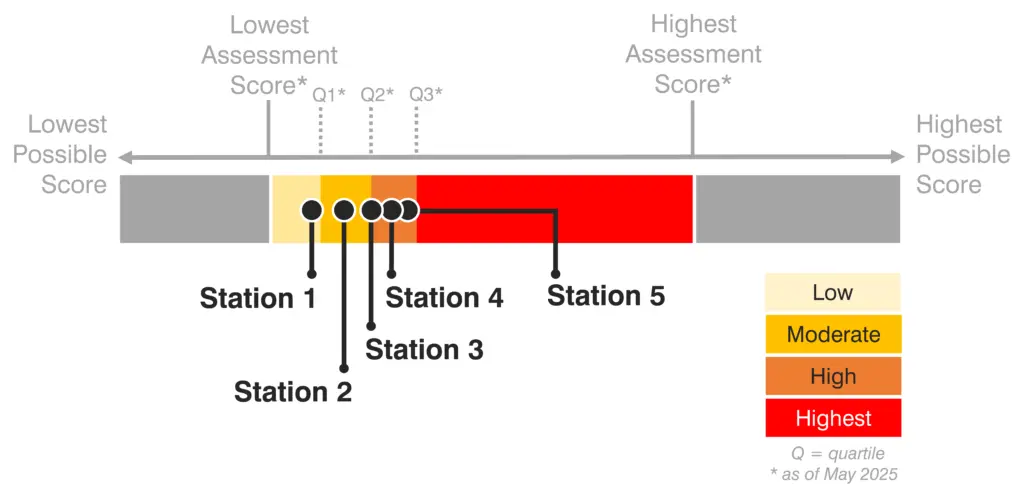
Comparative vulnerability scoring highlights significant variability among pump stations, with results distributed across a range of categories from low to high (Figure 8). This spread illustrates how, even within the same asset class, site-specific factors such as location, system design, and existing protections can drive markedly different vulnerability outcomes.
Two pump stations scored at the lower end of the spectrum, reflecting fewer past impacts and stronger adaptive measures, while the three others fell into the moderate-to-high range due to greater operational sensitivity. The pump station which scored the highest vulnerability of the five was driven by both high exposure to multiple hazards and limited redundancy of critical systems.
By presenting results in a format that shows each community’s assets relative to others of the same type, utilities and decision-makers can better understand where their facilities fall along the vulnerability spectrum. This approach not only allows communities to see how their own assets compare internally but also provides context for their level of vulnerability across multiple communities.
These results underscore the value of the vulnerability scoring framework not only in identifying at-risk assets but also in creating a structured pathway for future planning. By translating exposure, sensitivity, and adaptive capacity into composite vulnerability scores, communities can gain a clear, evidence-based understanding of where their systems are most susceptible. Importantly, these scores can be directly integrated into existing asset management systems, where they complement traditional data such as condition, maintenance history, and replacement cost. This integration allows utilities to prioritize capital improvements, schedule maintenance, and plan upgrades with climate risk in mind.
At the same time, the scores support compliance with evolving regulatory requirements such as NPDES permits by providing a defensible basis for identifying critical assets and planning adaptive measures. In this way, the vulnerability assessment results move beyond a static report to become a practical decision-making tool embedded within day-to-day asset management practices.
FIGURE 8. Vulnerability scores for five pump stations in one New Hampshire community. This illustrates the variation among assets within the community and their relative position when compared across a broader community scale.
Benefits of Conducting a Vulnerability Assessment Using the Given Approach
Scalability: The vulnerability assessment framework is designed to be adaptable across systems of different sizes and complexities. Its modular structure—based on exposure, sensitivity, and adaptive capacity—allows the same methodology to be applied to anything from small utilities with a few assets to large systems with more extensive infrastructure. By using regional climate projections, existing asset data, and standardized scoring, the framework ensures consistent evaluation while remaining flexible to local conditions. This scalability not only supports system-specific adaptation planning but also enables cross-community comparisons, helping to prioritize investments and inform resilience strategies at broader regional or statewide scales.
Flexibility: The vulnerability assessment framework is inherently flexible, allowing it to evolve as new climate science, data, and regulations become available. Its modular design and reliance on standardized yet adaptable indicators mean that updated climate projections or revised risk models can be incorporated without overhauling the entire process. This iterative structure ensures that assessments remain current and actionable, enabling utilities to refine strategies in step with emerging climate trends and regulatory requirements. Such flexibility strengthens long-term resilience planning by allowing utilities to move from a static, one-time analysis toward a living process that adapts with both science and policy.
Prioritizing Projects: The vulnerability assessment framework is structured to guide utilities in prioritizing resilience investments by pinpointing assets most at risk from climate hazards. Through the combined evaluation of exposure, sensitivity, and adaptive capacity, the process identifies critical vulnerabilities and translates them into actionable insights for decision-making. This “more-bang-for-the-buck,” targeted approach enables utilities to allocate resources to measures that yield the greatest resilience gains, balancing cost-effectiveness with long-term service reliability, regulatory obligations, and protection of public health and the environment.
References:
Lemcke-Stampone, M.D, C.P. Wake, and E.A. Burakowski (2022) New Hampshire Climate Assessment 2021. Sustainability Institute, University of New Hampshire. https:// scholars.unh.edu/sustainability/71/
About the authors:
John Sykora, III, is a Vice President at Weston & Sampson in Portsmouth, New Hampshire with over 25 years of experience providing project management, design, construction administration and inspection, and resident engineering for water and wastewater projects. He earned his Bachelor of Science in Civil Engineering from Norwich University.
Indrani Ghosh, PhD, is a Senior Associate at Weston & Sampson in Boston, Massachusetts with over 20 years of experience as a water resource engineer and as a technical lead in climate change resiliency projects, specializing in leading interdisciplinary teams and stakeholders through risk-based prioritization of adaptation solutions. She earned her Doctor of Philosophy in Environmental Engineering from Northeastern University, her Master of Science in Environmental Engineering from the Indian Institute of Technology, and her Bachelor of Science in Materials & Metallurgical Engineering from Jadavpur University.
Rupsa Roy, PhD, is a Technical Specialist at Weston & Sampson in Reading, Massachusetts with over 20 years of experience researching extreme weather patterns and has worked with multiple municipalities and public agencies to support their hazard and vulnerability planning, modeling their exposure to extreme heat, sea level rise/storm surge, and extreme precipitation. She earned her Doctor of Philosophy in Environmental Geochemistry from Florida State University, her Master of Science in Applied Geology from the Indian Institute of Technology, and her Bachelor of Science in Geological Sciences from Jadavpur University.
Cassidy Yates, EIT, LEED® GA, is a Climate Resiliency Engineer at Weston & Sampson in Reading, Massachusetts with eight years of experience on a variety of resilience projects to assess, model, and minimize vulnerability to changes in current and future weather patterns. A LEED® Green Associate, she earned her Master of Science and Bachelor of Science in Environmental Engineering, both from the University of New Hampshire
Christina Rambo is a Resilience and Adaptation Manager with the New Hampshire Department of Environmental Services Drinking Water and Groundwater Bureau and Wastewater Engineering Bureau in Concord, New Hampshire. She has over 10 years of experience and specializes in developing programs to enable wastewater and drinking water infrastructure to prepare for the current and anticipated impacts of extreme weather. She earned her Master of Science in Environmental Sciences from Towson University and her Bachelor of Science in Physical Sciences from the University of Maryland.