[Identifying PFAS] inputs to your POTW is more difficult than you may think
Articles
Identifying PFAS inputs to your POTW is more difficult than you may think
April 30, 2026
Steven Larosa, Weston & Sampson, Waterbury, VT
Linda Cook, Weston & Sampson, Reading, MA
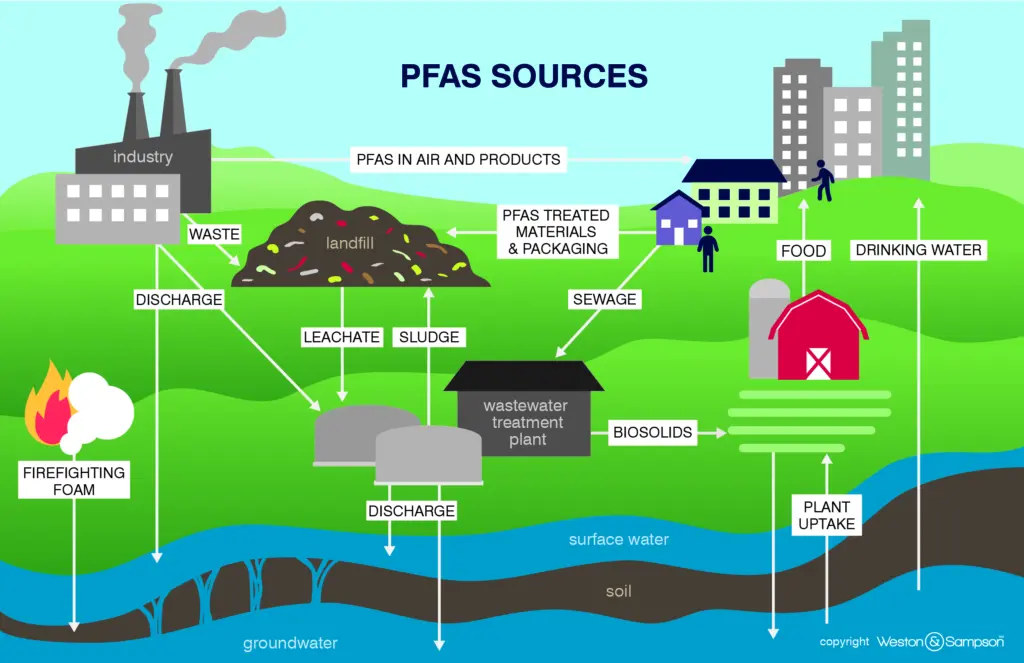
The pervasiveness of poly- and perfluorinated alkyl substances (PFAS), aka “forever chemicals,”, throughout our environment and in consumer products is well known (Figure 1). Many of these compounds have the potential for significant health impacts at extraordinarily low concentrations. The US Environmental Protection Agency (EPA) and individual state “roadmaps” for regulation and reduction of PFAS exposures include development of discharge limits for publicly owned treatment works (POTWs).
Regulatory limits on PFAS in discharges from POTWs are anticipated in the coming years. Operators will see increasing pressure to measure and reduce PFAS concentrations in influent, effluent, and biosolid residuals. In fact, many National Pollutant Discharge Elimination System (NPDES) permits currently require monitoring of PFAS despite the lack of regulatory discharge limits. POTWs are passive receivers of PFAS, as they do not generate these compounds themselves.
This article integrates lessons from statewide and regional studies and discusses the complex framework to be considered by POTWs to assess PFAS loading, prioritize source reduction, and plan for future compliance. Data and findings presented in this publication arose from studies conducted over the past several years with the Vermont Department of Environmental Conservation (VTDEC) and Connecticut Department of Energy and Environmental Protection (CTDEEP), as well as research into similar projects in Massachusetts and California.
Current EPA maximum contaminant levels (MCL) for two legacy PFAS compounds in drinking water – perfluorooctane sulfonate (PFOS) and perfluorooctanoic acid (PFOA) – are four parts per trillion (ppt) each. Individual New England states have established their own drinking water MCLs for multiple individual PFAS, often also in single ppt concentrations. It is anticipated that once POTW discharge limits and surface water quality limits for PFAS are established, they will be comparable to, or even less than, those for drinking water. Tens of millions of dollars have already been invested to remove PFAS from drinking water to mitigate direct human consumption. Many millions more must be spent to achieve the new EPA MCL of four ppt by 2031. Should treatment to this level be necessary at POTWs, it will likely require up to five times the capital investments made for drinking water. Additionally, the PFAS “roadmaps” developed by the EPA and individual states prioritize identification and installation of pre-treatment at industrial PFAS user locations within the POTW collection system. The assumption is that removal of these PFAS discharge sources will result in the significant reduction and/or potential elimination of PFAS in POTW influent. In highly industrialized areas with multiple or large scale PFAS dischargers, this strategy could significantly reduce the mass of PFAS entering the POTWs. However, the total PFAS loading to a POTW may not be dominated by “industrial user” discharges. If this is the case, an individual POTW may not be able to reduce PFAS discharge without utilization of additional treatment at their facility.
Figure 1. The pervasiveness of PFAS throughout our environment and consumer products has the potential for significant health impacts at extraordinarily low concentrations
PFAS Dynamics at POTWs
Since the early 2000s, a number of legacy PFAS (e.g., PFOA and PFOS) have either been removed from manufacturing or replaced with PFAS compounds with shorter side chains or different functional groups. Many of these replacement chemistries (precursors) are not quantified by standard PFAS analytical methods. However, these precursors can oxidize or biodegrade during POTW processes into terminal PFAS which are analyzed by standard PFAS methods and may be regulated. Consequently, POTW operators may observe higher measured total PFAS concentrations in effluent than influent due to precursor transformation. This does not imply creation of new PFAS mass during POTW processing but rather reflects conversion to species measured by standard methods. Precursor compounds can be a significant contributor to PFAS mass entering POTWs.
As a result, POTWs continue to be receivers of PFAS compounds. Since POTWs are not designed to remove or destroy PFAS, they persist through the treatment process and are ultimately found in both the effluents discharged to receiving waters and the residual solids (e.g., sludge or biosolids) generated by these facilities. POTW operators need to understand the dynamics of PFAS intake, transformation, and discharge to effectively plan for and meet regulatory requirements in the future.
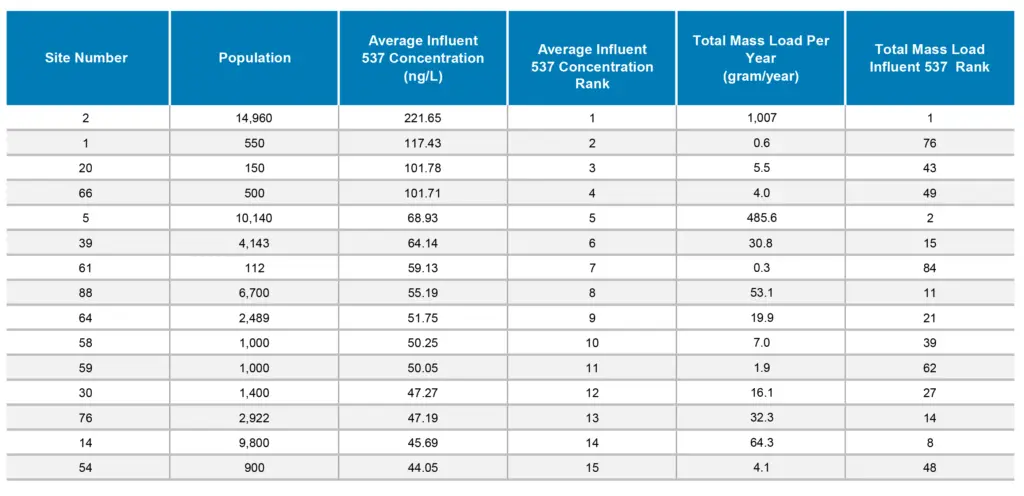
Table 1: Summary of population, ∑PFAS concentration, and total mass load per year for the 15 POTWs with the highest concentrations of influent ∑PFAS concentrations. Rankings are presented based upon comparison of all 91 POTWs in the study.
Insights from Regional Studies
The reduction of the sources, transformation, and fate of PFAS compounds in POTW processes is a topic receiving much attention and evaluation in both municipal and industrial arenas. PFAS source dynamics, POTW treatment impacts, and seasonal temperature fluctuations may result in unexpected and varying levels of PFAS in the influent, effluent, and biosolids of the POTW. Understanding PFAS loading into, and treatment system operation impacts on residuals and effluent is critical in order to set achievable regulatory effluent limits, and for operators to evaluate how PFAS may impact their capital budgets for many years to come.
Statewide studies, such as in Vermont1 and Massachusetts2, and individual POTW datasets show that PFAS is ubiquitous in influent and effluent, with wide temporal and spatial variability across grab type samples within and between facilities. Facilities serving larger populations can exhibit higher mass loads even when influent and effluent concentrations are modest, while small-flow facilities may show high concentrations but low total mass. Many factors may be affecting the variability of PFAS concentrations in POTW grab samples, including sewer shed source demographics (commercial, industrial, residential, landfill leachate, septage, etc.), seasonality, flow, and suspended solids.
Previous investigations and reports from across the US indicate that PFAS are present in all wastewater influents and effluents, including at facilities primarily receiving wastewater from residential sources. This finding confirms that PFAS contamination in wastewater originates from industrial/commercial sources as well as residential sources.
Table 2: Summary of population, influent ∑PFAS concentration, and total mass load per day per capita for the 15 POTWs with the highest concentrations of influent ∑PFAS concentrations. Rankings are presented based upon comparison of all 91 POTWs in the study.
In more rural cities and towns with little industry, the total PFAS mass loading from households may actually exceed that of PFAS loading from industrial wastewater discharges. Pretreatment of wastewater or cessation of PFAS use by the industry would be expensive and might not result in measurable benefits to the POTW. Understanding the concentrations, flows, seasonal variations, and overall usage dynamics in not only the POTW influent, but in the sewer sheds within the collection system, will be necessary to effectively target areas for potential PFAS discharge reductions.
Numerous studies have been performed nationwide to better understand the loading of PFAS into POTWs and the potential dynamics of transformation and retention of PFAS in POTW residuals. Many of these studies have focused on reduction of influent PFAS through reduction of industrial PFAS user discharges. Several New England states have evaluated PFAS in POTW wastewater and require sampling for PFAS in NPDES discharge permits. The data generated by a number of these studies have been evaluated and reviewed with an eye towards determining if the current NPDES sampling provides sufficient data for a POTW operator to evaluate the need for PFAS loading reduction due to industrial inputs. The data and conclusions discussed in this article primarily revolve around information gathered during a Vermont statewide POTW sampling study.
The Vermont study included quarterly sampling at a total of 91 POTWs for a period of one year. Influent and effluent grab samples were collected at all 91 facilities, each of which was analyzed for individual PFAS using Method 537M with isotope dilution quantification for 40 individual PFAS compounds. This analysis method is representative of what has been required for NPDES testing and includes many of the terminal PFAS compounds and some precursor PFAS that can be degraded.
During sampling, relevant environmental data were recorded, including sampling locations, POTW flow volumes, and weather conditions. These data were used to determine concentration and degradation trends seasonally and to calculate estimated PFAS mass loading and discharge rates at each POTW.
Concentration-based Loading Evaluation
The Vermont study data confirms that all of the POTWs receive wastewater containing measurable concentrations of PFAS. However, the influent concentrations are not effective at predicting if industrial discharges are impacting the sum of PFAS quantified by Method 537M (∑PFAS) loading to the POTW. Of the 91 POTWs in Vermont, 84 report average ∑PFAS influent concentrations of less than 50 ppt. This concentration is often referenced in other studies and regulatory guidance as representative of “residential wastewater sources” and is well below anticipated concentrations impacted by industry. The low-level concentrations could be due to dilution from infiltration, combined sewer/stormwater collection, or relatively low industrial flows. These relatively low ∑PFAS concentrations were observed at POTWs known to have industrial inputs and those with primarily residential inputs. Table 1 summarizes data collected from the 15 POTWs with the highest average ∑PFAS influent samples. Each facility in the study was assigned a ranking from highest concentration (1) to lowest concentration (91) based on ∑PFAS concentrations by Method 537M. Also included in Table 1 is the approximate population served by the selected 15 POTWs. No clear trends are seen between the population served and concentration of ∑PFAS in the influent samples. In fact, several of the highest ∑PFAS influent concentrations were found in POTWs that serve fewer than 500 people.
Total PFAS Mass-Based Evaluation
The average total mass of ∑PFAS entering a POTW does not appear to be a representative factor in determining industrial inputs either. Facilities serving large residential populations with relatively high flow rates and relatively low ∑PFAS concentrations will result in a relatively high influent mass load compared to a low-flow POTW with high ∑PFAS concentrations. Table 2 summarizes the mass loading and resulting rankings at the same 15 POTWs. A clear correlation in population to total mass loading rankings was observed regardless of influent concentration ranking. Facilities 1, 20, and 66 have top-five influent concentration rankings but mass loading rankings of between 43rd and 76th due to the very low populations served. In contrast, review of the recently-completed Massachusetts POTW study found that larger POTWs generally showed higher ∑PFAS concentrations and greater ∑PFAS mass loading.
The majority of the studies reviewed used average ∑PFAS influent concentrations for loading analyses due to the high variability in ∑PFAS reported for each grab sample collected. Grab sampling can report order-of-magnitude variability (10 times) between sampling events. Without detailed data collection from within the sewer sheds of the POTW, it is nearly impossible to ascertain the causes and sources of this variability. A treatment system constructed based upon ∑PFAS concentration data from only a few data points collected at the POTW influent may be over or under designed. Composite sampling and sewer shed-targeted sampling will improve the resolution and understanding of PFAS impacts to the POTWs.
These findings have a significant impact on how POTW operators assess PFAS concentrations entering their facility and the need for assessment of individual dischargers’ contributions. The current NPDES permit-required influent flow rate and ∑PFAS sampling does not appear to indicate if the POTW is receiving a mass load of ∑PFAS above the “typical” residential loading due to industrial inputs.
Per Capita Based Evaluation
To account for differences in the flows and size of the populations served by individual POTWs, ∑PFAS mass loading rates can be normalized on a per capita basis. This normalization provides a relative indicator of ∑PFAS mass loading independent of the volume of wastewater treated. This calculation also provides a better comparative tool to determine if a POTW appears to be receiving ∑PFAS from sources greater than “typically” seen in residential scenarios. Table 2 shows the same facilities (1, 20, and 66) with influent concentration rankings in the top five, with ∑PFAS mass loading per capita rankings of 77th, 3rd, and 19th respectively. Clearly, facility 20’s elevated per capita loading rate is much higher (approximately 10 times) and may be reflective of a discrete, high-concentration PFAS discharger or anomalous grab sample concentrations.
Facilities 76 and 64 serve similar “larger” populations but the ∑PFAS loading rate per capita at facility 76 is twice that of facility 64. Population served does not appear to correlate with per capita loading rate in the Vermont study.
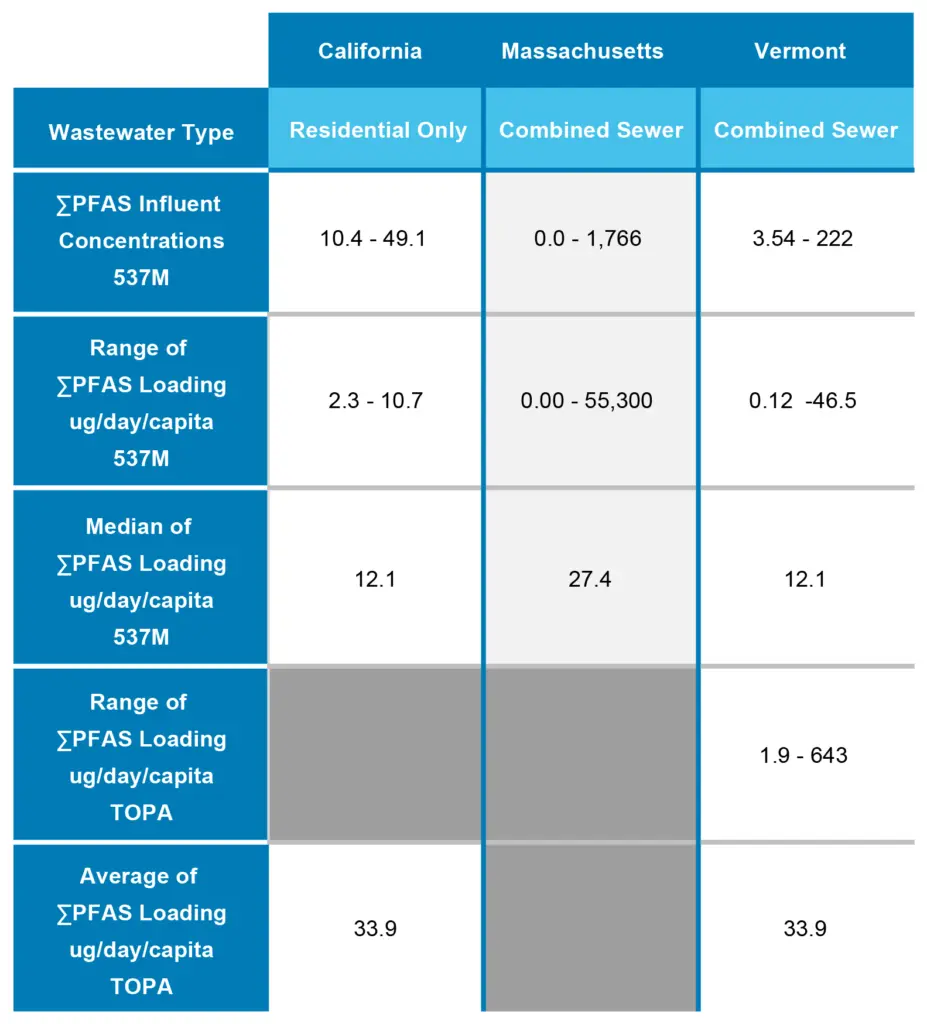
Table 3: Summary of calculated per capita ∑PFAS discharge rates.
Table 3 shows a summary of calculated per capita ∑PFAS discharge rates from studies in California3, Massachusetts, and Vermont. The discharge rate per capita ranges over nearly 5 orders of magnitude from 0.12 micrograms per day (ug/day) (4.2 (10-9) ounces per day (oz/day)) to 55,300 ug/day (0.0020 oz/day). The California study was performed on wastewater strictly sourced from residential neighborhoods has a median loading rate of 12.1 ug/day (4.3 (10-7) oz/day) per capita. The Vermont study reports approximately the same median per capita loading rate of 12.1 ug/day (4.3 (10-7) oz/day) per capita. However, the Massachusetts study indicates a median per capita loading rate of 27.4 ug/day (9.7 (10-7) oz/day), which was about 2 times higher than California or Vermont. This may be due to Massachusetts having more industries discharging PFAS or it may be indicative of PFAS trends in POTWs serving larger populations than Vermont or residential neighborhoods in California. The Massachusetts study indicates “there were no significant associations between population and estimated ΣPFAS mass loading per capita,” confirming the Vermont findings discussed above.
Standard PFAS testing (Method 1633 and 537M) only quantifies a fraction of the possible PFAS mass present in influent, effluent, and residuals. State studies from Vermont and Massachusetts used alternate test methods and showed that a significant portion of the mass of total PFAS entering POTWs was not quantified by the standard PFAS methods.
The alternate sample preparation method Total Oxidizable Precursor Assay (TOPA) was also utilized in the studies. TOPA uses strong oxidants to convert oxidizable precursors to terminal PFAS, thus revealing “hidden” precursor mass with the potential to transform into measurable PFAS during POTW processes. Oxidized precursors can then be measured using standard PFAS methods. As such, TOPA can provide a proxy measurement for “total PFAS” to aid with normalizing measurements within and between POTWs. There is however not yet a standard method available for TOPA analysis. Due to the importance of understanding the complete PFAS picture though, EPA and other agencies are actively working on drafting a standardized method for TOPA.
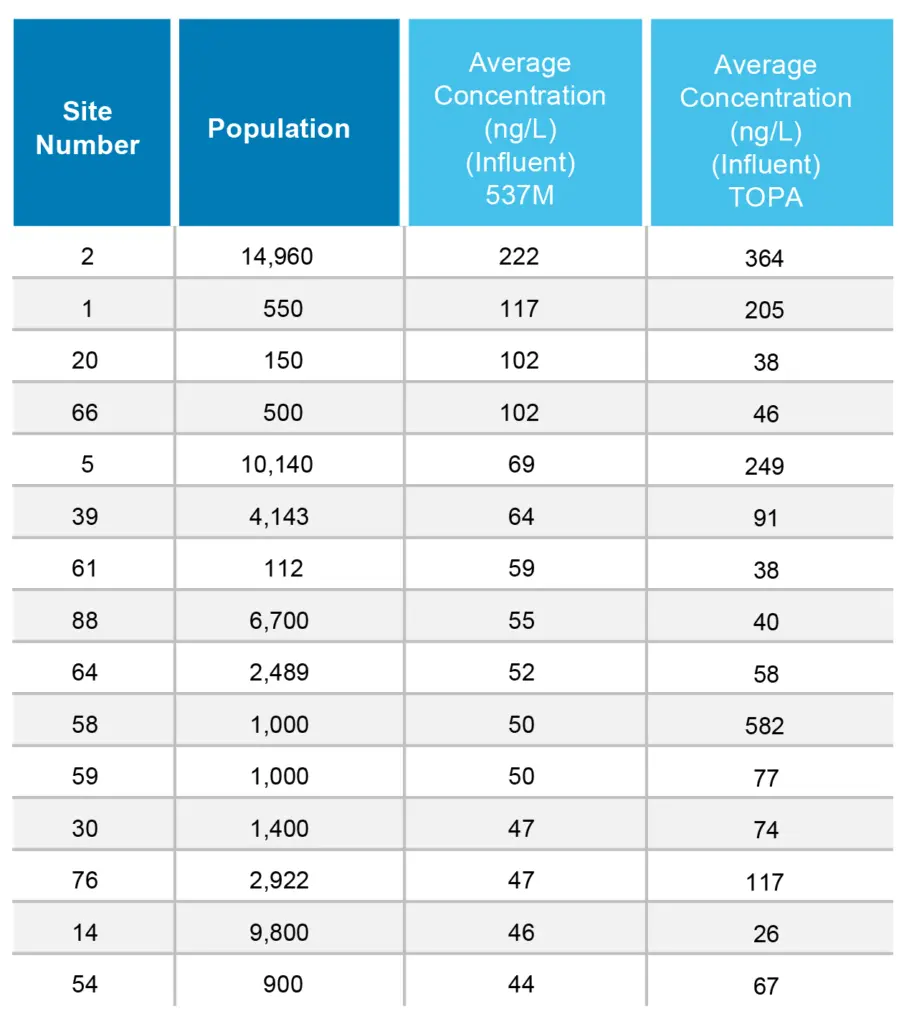
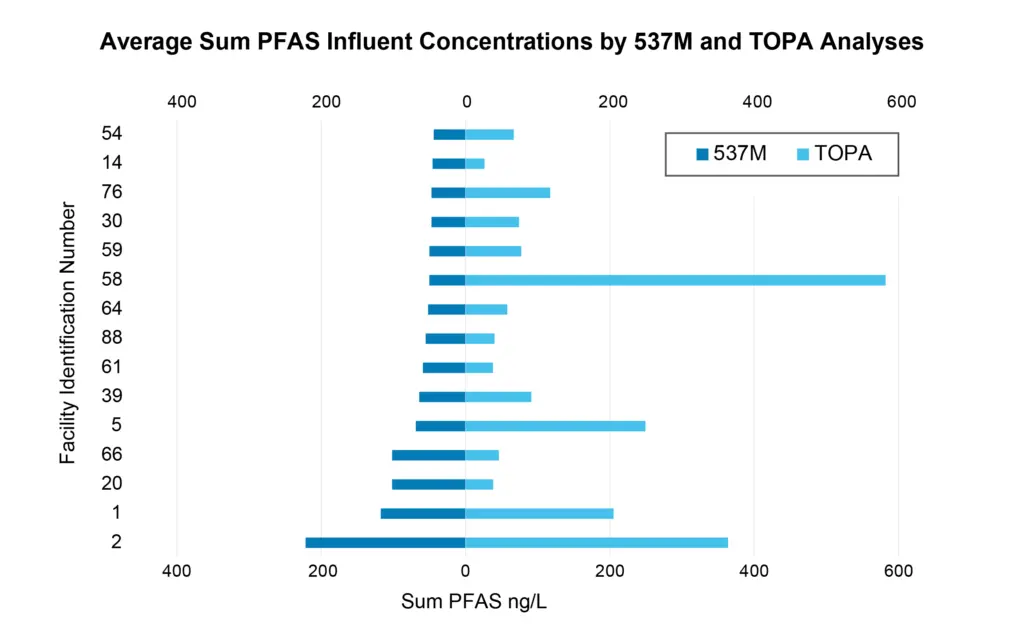
Table 4: Comparison of average ∑PFAS influent concentrations via 537M and TOPA analyses.
Table 4 compares average ∑PFAS concentrations for influent samples using Method 537M with the TOPA concentration from the same sample for the 15 facilities in Vermont with the highest ∑PFAS concentrations by Method 537M. A graphical representation of the data is also shown in Figure 2. According to the study reports, the TOPA results indicate that PFAS precursor compounds generally cause a statistically significant increase in the ∑PFAS concentrations reported in influent samples.
Figure 2: Graphical representation of data in Table 4
The TOPA results from the Vermont study indicate ∑PFAS loading rates are an average of 3.5 times higher than those predicted by 537M alone. Comparison of the mass loading (influent) to mass discharge (effluent) actually indicates that study wide slightly less ∑PFAS mass is being discharged based on 537M results, and nearly half as much ∑PFAS is being discharged based on TOPA data. This indicates that not only is there a substantial mass of precursors entering the POTWs but that the POTW treatment processes do not fully break down precursor PFAS prior to effluent discharge to surface water.
It is speculated that the reduction in ∑PFAS mass in the effluent is due to absorption/uptake of PFAS in biosolids. This has significant potential impacts on biosolids treatment and management techniques available to facility operators. Maine has banned land application of biosolids and many New England landfills now either limit biosolids received or have discontinued accepting biosolids altogether. Evaluation of the types of individual PFAS and precursors contained within biosolids is ongoing. Multiple studies performed to date indicate that quantifiable levels of PFAS exist in all POTW biosolids. Multiple challenges regarding accurate and representative analysis of sludge and biosolids have made understanding PFAS transfer/absorption dynamics difficult.
There are several other alternative analyses designed to report total PFAS presence in wastewater. These include absorbable organic fluorine (AOF; Method 1621), total organic fluorine, and total fluorine. While these analyses do not report specific PFAS, they do give a relative concentration of organic or total fluorine present in the wastewater. Studies indicate that up to 86% of the fluorine mass reported in wastewater is associated with PFAS that are not quantified using the standard PFAS or TOPA quantification methods. Therefore, the anticipated total PFAS loading to POTWs may actually be significantly higher than currently estimated. The challenge with these methods is that they cannot differentiate between organic fluorine associated with PFAS or organic fluorine associated with other organofluorine compounds like pharmaceuticals or pesticides that may be present in influent waste streams.
DISCUSSION
Understanding the dynamics of PFAS loading rates and the characteristics of the PFAS being received is essential for POTW operators to evaluate the need for PFAS reduction in their influent, effluent, and biosolids/sludge handling operations. Our understanding of the source types and degradation of PFAS associated with wastewater treatment is ever-changing. The diversity of POTW sizes and characteristics of dischargers makes for wide-ranging and unpredictable PFAS loading predictions. The utilization of current NPDES permit-style flow and grab sample analysis data do not provide sufficient information to manage PFAS impacts at POTWs.
Confidently understanding PFAS loading is required for facility operators to effectively evaluate methodologies for PFAS source reduction, to determine if significant industrial commercial PFAS dischargers exist, and if source removal will be effective. It appears that utilization of PFAS loading rates normalized to the number of service connections or individuals within the POTW collection area could be an effective evaluation tool. However, further studies are required to establish “non-industrial PFAS discharger” loading rates. The per capita discharge rates could potentially be utilized as a screening method to determine if further evaluation of sewer sheds and individual dischargers should be performed.
Consideration of “normal” or “residential” per capita loading rates may also be essential in setting regulatory requirements for POTW effluent quality. Significant reduction in residential PFAS loads is not anticipated to occur anytime soon, as it appears economically untenable to require POTWs to treat wastewater to levels below “typical” residential concentrations. Establishment of effluent discharge concentrations should also consider the extraordinary costs associated with PFAS removal and/or destruction from wastewater effluent. Treatment of an entire POTW’s influent flow will be considerably more complex than individual pre-treatment of a specific industrial process wastewater.
CONCLUSION
Although regulatory limits and constraints are not currently in place, POTW operators and the regulatory community will be best served by continuing to perform PFAS loading studies. Significant additional study is needed to determine the best “standard” methods for PFAS-related impacts to POTW operations. Continued study of individual sewer sheds will assist with understanding PFAS loading dynamics. Composite sampling should be incorporated into these studies to determine if PFAS loading is significantly changed between business hours and traditionally off-business hours. These data will be vital in determining design parameters necessary for PFAS removal. The data will also assist in identifying the potential substantive dischargers of PFAS to the collection system.
Although not discussed in detail here, the potential impacts from septage receipt and treatment at POTWs can be significant. A thorough understanding of all sources, loading dynamics, and total PFAS load to a POTW is essential if we are to understand options for reduction and treatment.
The authors would like to extend their sincere appreciation to Dr. Paula Mouser with the University of New Hampshire and Eamon Twohig with the Vermont Department of Environmental Conservation for their invaluable assistance.
References
Weston & Sampson Engineers, Inc. (2025), Per and Polyfluoroalkyl Substances (PFAS) Sampling of Vermont Publicly Owned Treatment Works (DRAFT).
Tighe & Bond (2025), Data Analysis Report, MassDEP PFAS Testing Study for NPDES POTWs.
Omobayo A. Salaw, Ziwei Han, Naomi L. Senehi, Shannon L. Roback, Adeyemi S. Adeleye, (2025), Determination of household wastewater PFAS composition and concentrations via neighborhood sampling, Journal of Hazardous Materials, Volume 498.
ABOUT THE AUTHORS
Steven LaRosa is an Associate at Weston & Sampson in Waterbury, Vermont. A geologist with more than 30 years of experience, he earned his Bachelor of Science in Geology with a Biology minor from Northeastern University.
Linda Cook is a Senior Technical Leader at Weston & Sampson in Reading, Massachusetts. An environmental chemist and data scientist with more than 35 years of experience, she earned her Master of Nutrition Science from Tufts University and her Bachelor of Science in Biology from Salem State College.