Articles
From Static to Strategic: Modernizing Capital Planning with a CIP App

Dan Shinnick,
Weston & Sampson, Reading, MA
Articles

How one water district used GIS to turn a static report into an adaptable planning tool
A capital improvement plan (CIP) is an important tool for organizations like water districts and local governments when planning, managing, and coordinating the expenditure of capital funds since they can help maximize the return on investment (ROI) over an asset’s life cycle. This article describes a solution that enabled a water district to more effectively manage its water mains by moving its CIP from a static report to an app.
Background
The Dedham-Westwood Water District, which provides water to two neighboring towns in Massachusetts, manages 208 miles of pipe that serve over 14,000 customers. Staying ahead of repair and maintenance is a constant challenge and balancing budgets and schedules can become daunting.
To assist in prioritizing improvements and justifying capital expenditures, we partnered with them to produce and regularly update their CIP. This is typically developed in three general stages:
The process produces a priority list of assets (PLA) that helps prioritize expenditures, maximizing asset life cycle and ROI. The CIP assesses multiple variables that range from the condition and history of water mains to paving schedules.
Projects are then organized into projects over the course of three to 20 years based on the priority of assets. Since CIPs have historically been a static report, if conditions change significantly then the plan’s recommendations may not reflect its original intent.
Assembling and evaluating all this data can be time consuming and is dependent on the condition and availability of resources. Because good data is required for good recommendations, ensuring data quality can sometimes consume 50 percent or more of a CIP’s generation.
Producing a Viable Solution
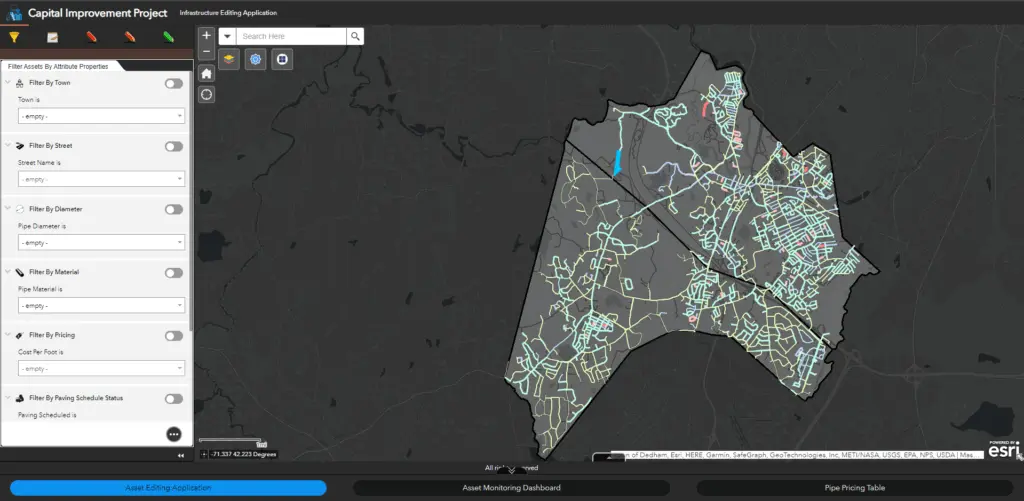
The district tasked us with producing a solution that would proactively assemble as much of this data and categorization as possible to produce an up-to-date PLA so that the project assignments could start immediately. This solution is the CIP Viewer and PLA generator.
We first helped establish the district’s CIP in ArcGIS Online. The open-source REST endpoint architecture of services in ArcGIS Online integrated seamlessly with the district’s existing software. We took advantage of the configurable nature of ArcGIS Online platform components to produce an application that responds to dynamically changing inputs. These could be the water main feature service in ArcGIS Online (e.g., age or material), an associated feature service (e.g., main breaks), or direct user input like paving schedules or costs.
The centerpiece element of the solution is the algorithm used to assemble and rank assets. The primary algorithm is a customized script included in a scheduled ArcGIS Notebooks task. The script is designed to be consistent with the approach developed in the original CIP and examines the input variables (preserved as feature attributes) and calculates priorities for each asset.
Prioritizing Assets
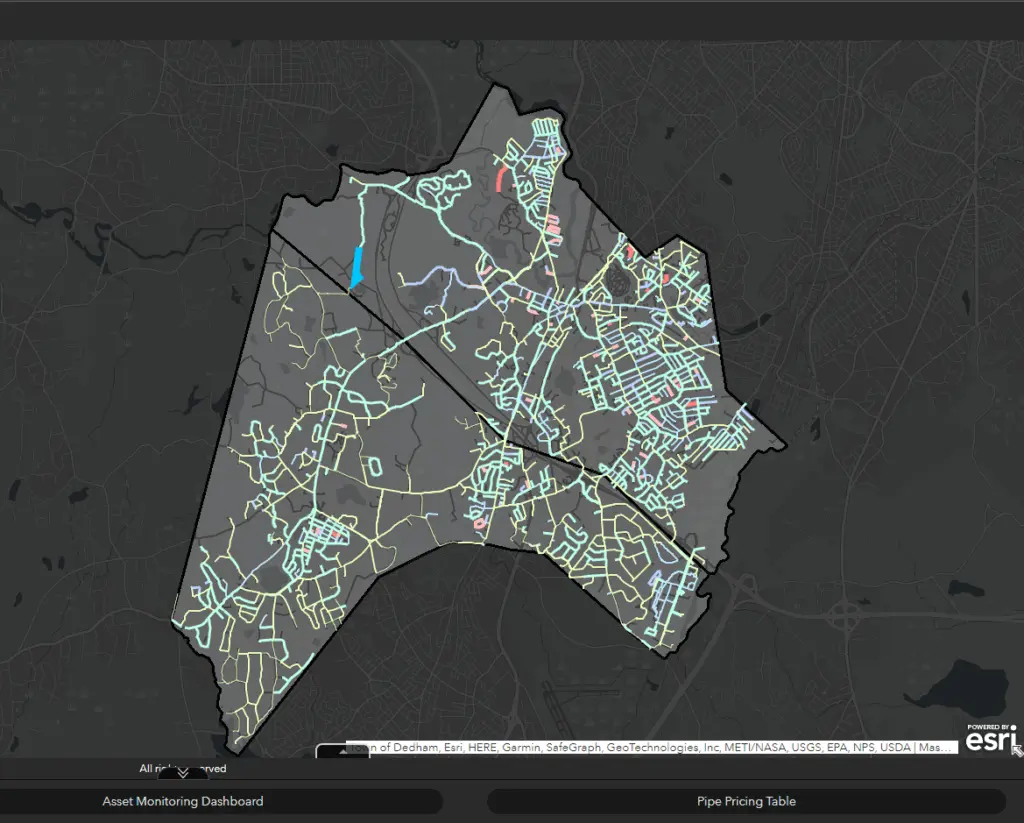
Asset proximity is assessed, allowing assets to be reprioritized based on the scores of neighboring assets and increasing efficiency through priority groupings. A summary dashboard allows users to look at the prioritized list of assets and offers a set of filters to review conditions, including a budget filter that will take as input a budget number and display a list of the highest priority assets based on that budget.
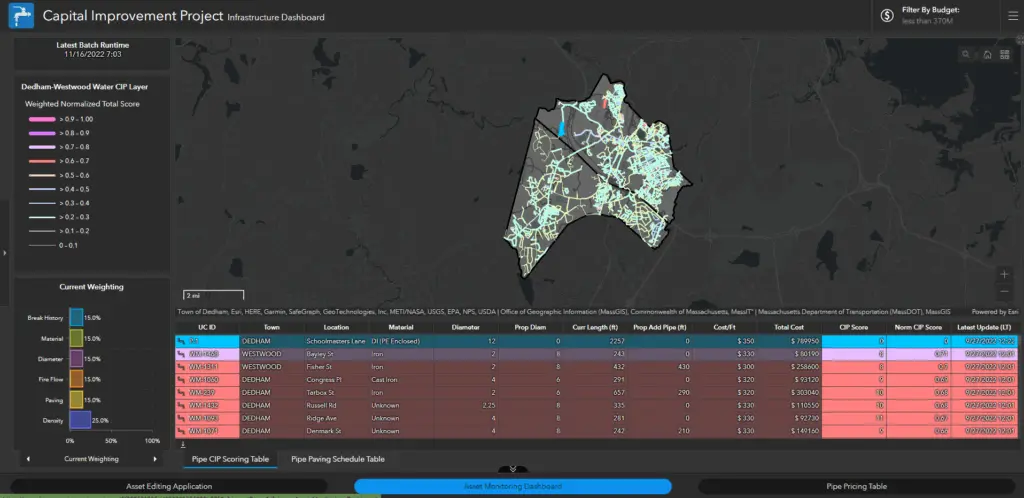
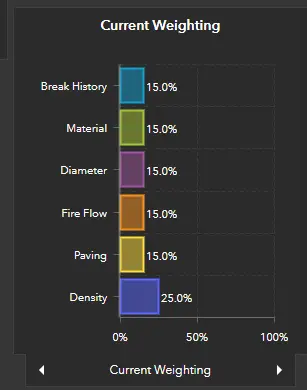
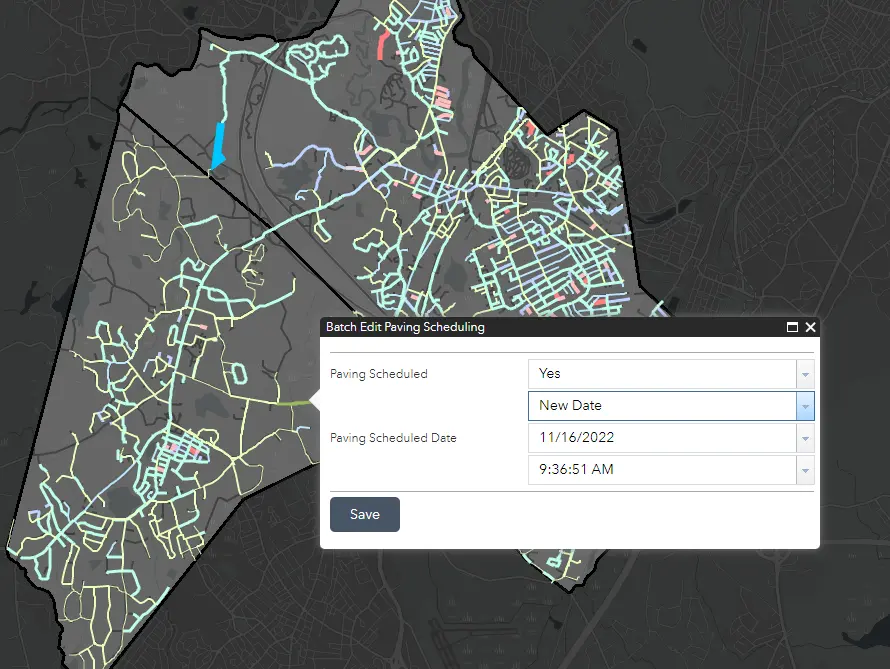
To give district staff some control over the algorithm, the solution includes the ability to manipulate inputs globally or at the level of individual assets, allowing for tailored cost estimates. For example, a default cost per foot for the replacement of a given diameter of pipe can be assigned, but that cost can be overridden on individual assets if conditions change. Also, weightings can be applied to individual variables that will redistribute priorities based on whichever factors the district chooses to accentuate.
If the system needs to be expanded to accommodate new developments or subdivisions, users can establish new assets to be considered in the CIP.
The algorithm establishes a separate set of assets to eliminate the need for managing temporary features in the district’s authoritative data. Each variable affecting the score is stored with the asset list so that users can see precisely which factors are influencing the score. This ensures transparency in the scoring process and allows users to tweak inputs and evaluate the effect on their budget and PLA.
A final list of assets is available for download as a spreadsheet. In this way, the tool provides a window on the current state of all the district’s assets and a way to evaluate a variety of response scenarios. Thus, the tool provides a meaningful place from which to start a discussion on expenditures.
The application provides a list of assets and justifications for their consideration as a capital expense. As this solution exists entirely in ArcGIS Online, it integrates directly with all other platform components such as ArcGIS Field Maps, expanding the ROI of the GIS investment.
Developed in just under seven months, the team is now working with the district on full implementation and user training. This will ensure that contributing components of the application are ingested as they become available, like the identification of paving schedules as a primary driver for expense.
Benefits
Savings will be most evident when creating a new CIP. This solution attempts to do all the front-end work, including the cost definitions on a rolling basis according to an existing approach, so users can get right to work defining projects while saving time and money. However, the district is already seeing benefits from greater visibility of the spatial distribution of variables impacting its planning budgets. The solution allows the district to remain purposefully flexible and responsive to developing needs.
Now What?
Next steps will be further integration with the asset management software to include assessment of fire flow readings at hydrants during flushing events. As one of the critical variables impacting assessment, this is a perfect step toward better development of the PLA.
The flexibility of the ArcGIS system means that those inputs can be used directly by the script. The district may elect to expand the solution to manage other assets like wells, tanks, and booster pump stations. Because these are all inventoried in the district’s ArcGIS Online organization, facilitating the integration of those assets is relatively easy.
The CIP Viewer and PLA generator is a tool that provides water managers with insight not only into the condition of their assets but also their organization’s ability to effectively minister to those assets. And because it does this actively, it is never out of date with current assessments, giving managers and stakeholders a window on their plan as it evolves.
Published in SCAWWA Journal Fall 2025 (this article was previously published in the Summer 2023 edition of ArcUser).


