Sudbury Water District: A Proactive Stance in a Dynamic PFAS Environment
Articles
Sudbury Water District: A Proactive Stance in a Dynamic PFAS Environment
July 1, 2026
Sara Guglielmi, PE, Weston & Sampson, Reading, MA
Andy Reid, PE, BCEE, Weston & Sampson, Reading, MA
Vincent Roy, Sudbury Water District, Sudbury, MA
This paper presents the design, implementation, and performance of a full-scale granular activated carbon (GAC) treatment system for per- and polyfluoroalkyl substances (PFAS) removal at the Sudbury Water District’s Raymond Road Water Treatment Plant (WTP). Faced with emerging regulatory requirements and detectable PFAS concentrations in groundwater sources, the District implemented a proactive treatment strategy with a full-scale demonstration study. System design considerations, operational performance, and treatment efficiency are discussed, along with challenges including media life and corrosion issues. Results demonstrate effective PFAS removal and ancillary benefits such as total organic carbon reduction. Lessons learned provide guidance for utilities addressing PFAS under evolving regulatory frameworks.
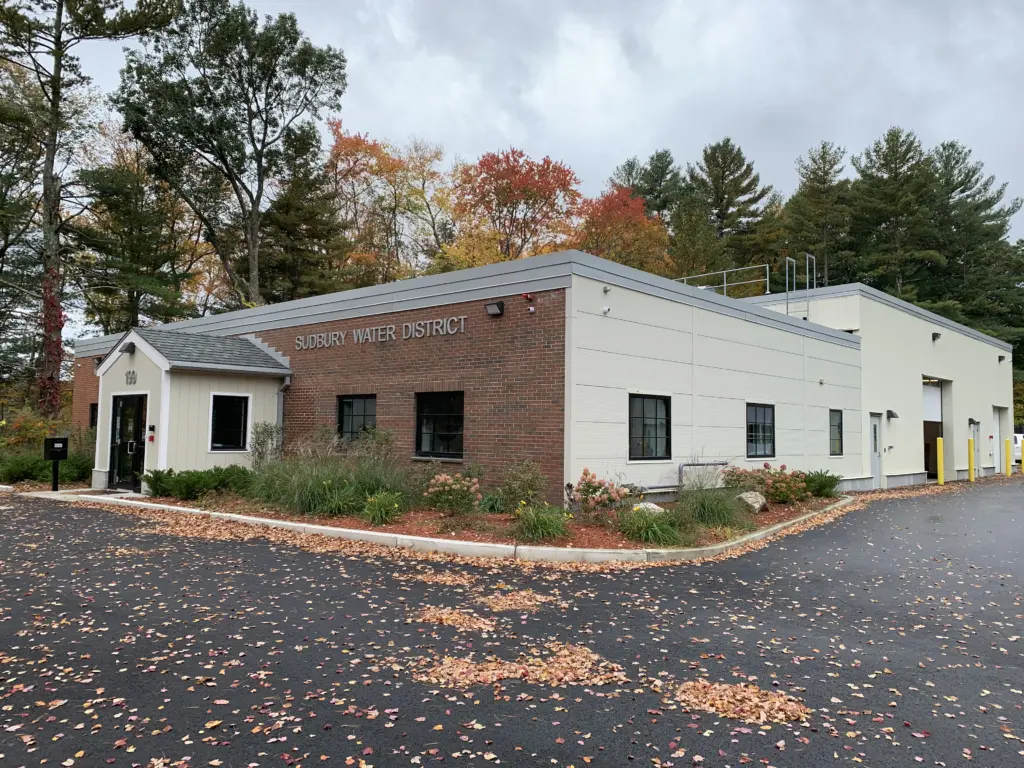
The Sudbury Water District (District), about 20 miles west of Boston, is an independent municipal entity established by an Act of the Massachusetts Legislature in 1934. Its mandate is to provide drinking water to the residents and businesses in Sudbury, along with water for fire suppression. In early 2020, the District elected to take advantage of funding available through a grant from the Massachusetts Department of Environmental Protection (MassDEP) to test the source water for per-and polyfluoroalkyl substances (PFAS).
Figure 1: The Sudbury Water District is an independent municipal entity established by an Act of the Massachusetts Legislature in 1934.
Through that effort, several of the groundwater supply wells serving the District were determined to be producing water impacted by PFAS. As such, the District (Figure 1) elected to tackle the issue head on and, knowing that new regulations were pending, embarked on the design of a solution for PFAS removal to provide the highest water quality possible to their customers.
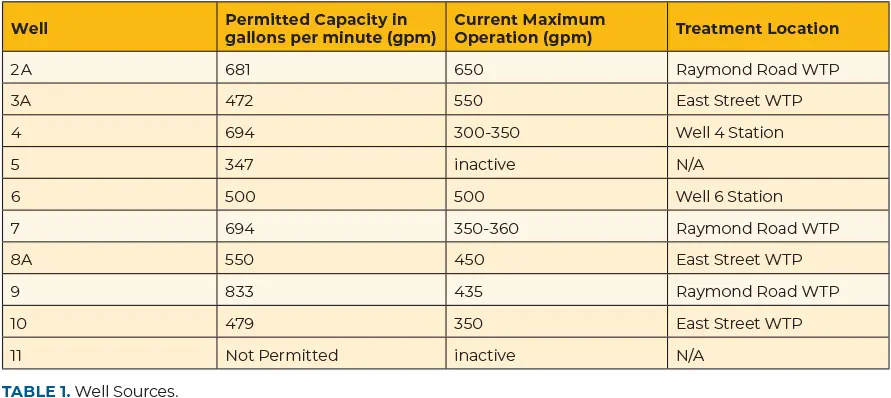
The District elected to begin with the Raymond Road Water Treatment Plant (WTP) (one of two such plants in the town) which supplies over half of their water demand. The wells supplying water to the Raymond Road WTP were among those with the highest levels of PFAS, with Wells 2A, 7, and 9 containing an average of 12, 14, and 14 parts per trillion (ppt) of “PFAS6”, respectively. PFAS6 refers to a group of six specific PFAS compounds regulated in Massachusetts drinking water, including PFOA, PFOS, PFNA, PFHxS, PFHpA, and PFDA, which combined are regulated at 20 ppt. Concentrations in the finished water coming from the Raymond Road WTP contained a PFAS6 range of 10 – 17 ppt as a result of the source wells containing such compounds. Historically, average daily water demands through the Raymond Road WTP have been 1.6 million gallons per day (MGD), with maximum daily demands of 2.1 MGD. The permitted capacities and current maximum operation of the wells are shown in Table 1.
With these levels of PFAS6, the District set about retaining a consulting firm to design and construct a treatment facility that would reduce PFAS to a level that meets all required drinking standards. The District’s goal was to supply their customers with the safest drinking water possible. This article focuses on the recently completed Raymond Road WTP PFAS treatment facility, including design components and post-construction lessons learned.
Treatment Alternatives Considered
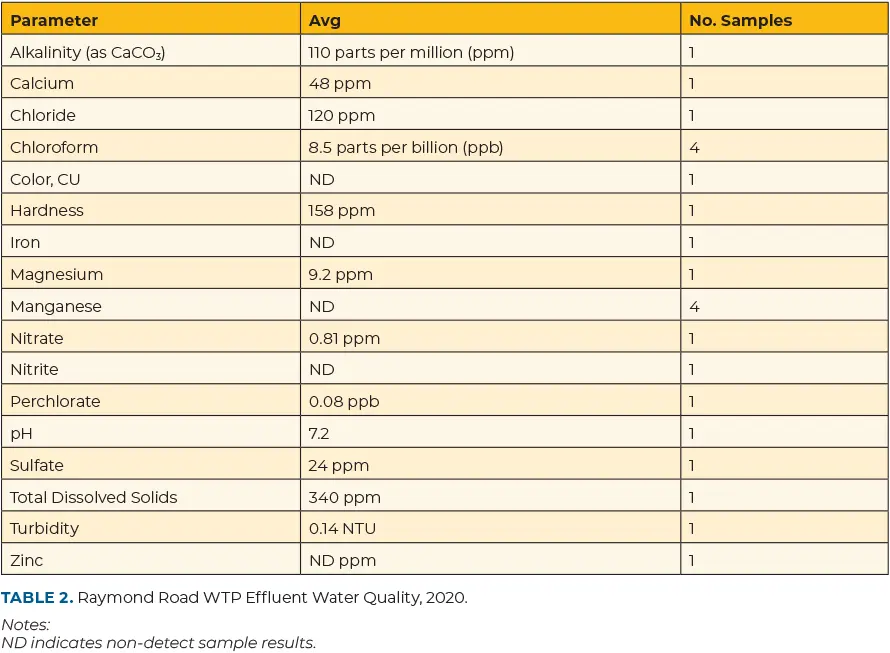
Co-contaminants that can negatively impact PFAS treatment efficiency include iron, manganese, and total organic carbon (TOC). To get a better handle on this, water quality leaving the Raymond Road WTP was analyzed for a variety of parameters to understand potential options for PFAS removal. Table 2 includes general chemistry at the WTP in 2020.
Treatment alternatives considered for the Raymond Road WTP included pressure filtration using ion exchange (IX) resin and pressure filtration using granular activated carbon (GAC). Pressure filtration using IX resins showed great promise but, based on our team’s experience at similar PFAS treatment plants, media costs were expected to be three to six times that of GAC. Also, the District preferred GAC to IX resin for its ability to remove TOC concurrently with PFAS, thereby reducing disinfection byproducts (DBPs) in the distribution system.
While the District had not sampled for TOC at the Raymond Road WTP, the plant treats groundwater, and color values were low. Therefore, it was assumed that TOC levels in the finished water were below 2 parts per million (ppm) and would not significantly impact PFAS treatment efficiency.
High volume sources with PFAS concentrations below 100 ppt and relatively low TOC concentrations (<2 ppm) showed promise for the cost-effective removal of PFAS with GAC filtration, as had been shown at several similar treatment plants in New England. Most of the PFAS detected in the raw water were the long chain, 8-carbon compounds which are generally considered to be more readily removed by GAC as compared to IX resin. Concentrations of iron and manganese in raw water were not likely to affect PFAS removal, since the existing greensand filters removed iron to concentrations below 0.05 ppm and manganese to concentrations below 0.005 ppm. Iron and manganese concentrations were subsequently evaluated to estimate impacts to filter hydraulics and backwash requirements. The evaluation showed that backwashing would be infrequent and headloss buildup minimal, given the low concentrations of iron and manganese present.
With PFAS6 concentrations approaching exceedance levels in the raw water, the District opted to replace a small-scale pilot study with a full-scale demonstration study, since it offered a shorter timeline to supply PFAS-free water while also collecting data to inform future decisions. Through the demonstration study, parameters like PFAS migration within the filter bed, hydraulic performance, and backwash frequency could be better understood. While GAC media has often been used in many drinking water applications, long-term costs and design optimization issues are best identified by full-scale pilot systems using existing source waters.
The goals of the treatment implementation plan included:
Evaluating PFAS removal efficiencies across the full bed depth of the lead GAC filter.
Monitoring hydraulic performance and general chemistry conditions.
Understanding TOC removal by GAC and its potential impacts on PFAS removal efficiency.
Providing PFAS removal while supplying up to 1,445 gpm of treated water to help meet system demand.
Sudbury PFAS Treatment System
Although the Raymond Road WTP was originally designed for a treatment capacity of 3,000 gpm, the PFAS treatment system was sized to accommodate operational flows, which remained below 1,445 gpm (2.1 MGD). By aligning the system with these lower flow rates, the number of required treatment units was reduced by half, resulting in a significant reduction in overall cost.
The design for the Raymond Road WTP included four 12-foot-diameter pressure vessels, each containing 30,000 pounds of virgin GAC, with two pairs operating in parallel. Intermediate sample taps allowed for water quality sampling at 32% and 64% of the filter bed depth, and ports were also placed at the effluent end of each filter. These sample taps ensured the system could be monitored to comply with drinking water standards and guidelines.
The filters operated at 225 – 725 gpm, which corresponded to an empty bed contact time (EBCT) of no less than 10 minutes per filter vessel. The original filter media installed was COL L1000, a GAC approved by MassDEP under the new technology list for PFAS removal, with raw water routed to the two filter pairs directly from the existing greensand filters. Filter effluent water was routed back into the plant for chemical addition in the same fashion as current operation. Following filter installation and media conditioning, water quality samples were taken at three sample points – raw, lead filter effluent, and lag filter effluent. Upon receipt of laboratory results verifying PFAS levels with a goal of less than 2 ppt, filter effluent was discharged to the system.
The pressure vessels were individually valved with pressure gauges before and after each filter to track head loss in the filters. Vessels were also equipped with a flow meter to track flow through the filters. Backwash water was supplied by the distribution system via an onsite hydrant, and backwash waste was routed to the existing lagoons, originally designed to accept residuals from the recycle basins.
Dechlorination took place prior to GAC filtration, as GAC media vendors at the time raised concerns of chlorine potentially breaking down the GAC media that would otherwise be a removal site for PFAS. Per their recommendations, sodium thiosulfate was added to reduce chlorine prior to the GAC filters. The unused potassium hydroxide system in the existing WTP was removed to make room for the sodium thiosulfate system. With dosing needs being low, liquid sodium thiosulfate was delivered in 55-gallon drums with a solution strength of 30%, with the feed pumps drawing directly from the drums.
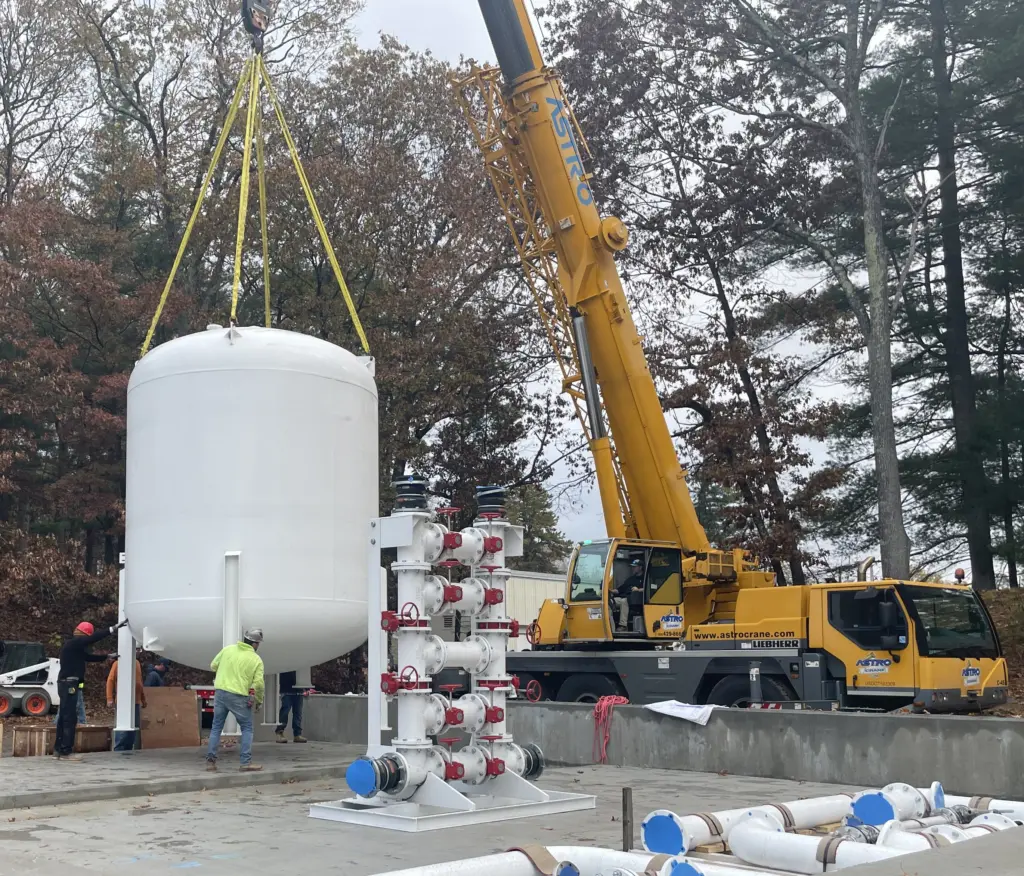
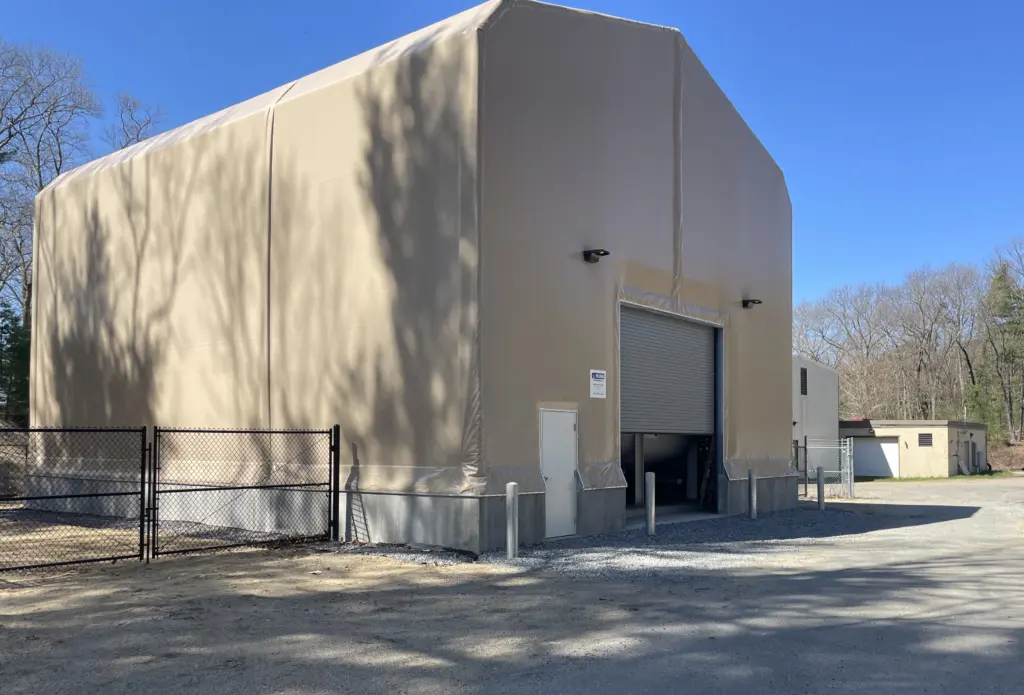
The PFAS treatment system was housed in a 50-foot by 40-foot, prefabricated, insulated membrane building atop a full foundation and poured concrete knee wall (Figure 2). The four 12-foot-diameter pressure filters and associated piping and valve racks were bolted to slabs constructed on the foundation, and above- and below-grade ductile iron pipework was installed to connect the new system to the existing WTP.
Figure 2: Installation of the GAC filter vessels for the PFAS treatment system.
Sampling Protocols and Laboratory Methodology All samples were collected by qualified personnel trained in sampling techniques for PFAS in accordance with the MassDEP’s “Field Sampling Guidelines for PFAS.” PFAS concentrations were analyzed monthly using the modified EPA 537 methodology, similar to samples previously collected, with reporting limits of 2 ppt or less for 14 individual PFAS compounds.
Historical use of GAC in Massachusetts With respect to PFAS contamination, GAC filtration was being used at several other municipal water systems in Massachusetts, and the technology has proven to be a beneficial filtration media. Co-benefits include improved taste and odor control and reduction in organic compounds. In the spirit of transparency and to build public trust, the project team took great care to notify District drinking water customers prior to the implementation of treatment operations at the Raymond Road WTP.
Corrosion Control Measures After initial GAC emplacement, pH was monitored at the filter effluent during backwash and filter-to-waste activities. Once filter effluent pH stabilized to the desired distribution system levels, and with acceptable PFAS sampling results, the system was turned online to the distribution system. Treatment levels were maintained to ensure the effectiveness of the phosphate-based corrosion control chemicals.
Pilot Testing Period The full-scale system was operated until breakthrough of PFAS compounds occurred through the first (lead) filter in the primary pair. At that time, the GAC media in the lead filter was changed out and the filter was placed in the lag position. The previous lag filter (now the new lead) was operated until breakthrough of PFAS compounds occurred, and the media was then changed out and the filters were placed back into their original positions
Benefits
The District experienced several benefits as a result of implementing PFAS treatment in the Raymond Road WTP process, namely:
Generally, GAC is more economical because it can be regenerated for reuse, whereas IX is typically considered a “one and done” treatment media for drinking water.
GAC has the secondary benefit of removing TOC. The District had a previous issue of high DBPs, and adding the GAC reduced the final TOC coming off the GAC filters. This ultimately reduced the District’s total trihalomethanes roughly in half in the distribution system.
GAC is generally considered to have fewer simultaneous compliance issues, with the main issue being pH increasing during the first bed volumes as the GAC ripens to normal operation.
Trouble in Paradise
Pipe Corrosion Shortly after system startup, two of the four 304L stainless steel pipes developed leaks at the welds of their 90-degree bends. These pipes were intended for media fill and removal and thus experienced stagnant water during normal operation. Notably, the issue was limited to upper horizontal pipe sections, with no damage observed in vertical or lower horizontal runs. Given the localized nature of the corrosion, there was concern that additional pinhole leaks may develop over time if conditions remain unchanged.
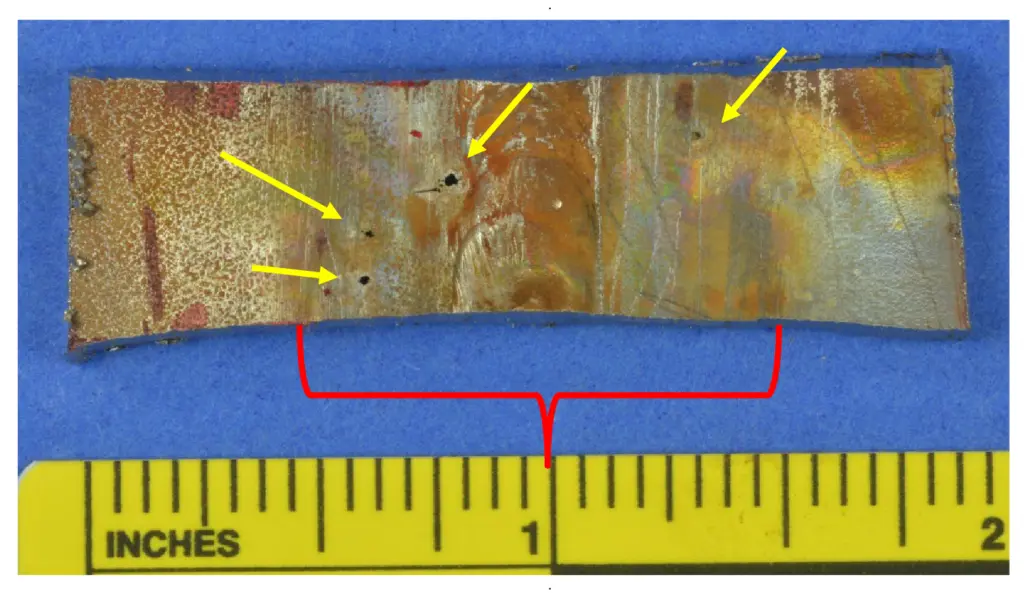
The team collected a sample from one of the failed pipes and confirmed the material to be 304L stainless steel. Microscopic analysis revealed pitting corrosion concentrated around the welds, particularly in the heat-affected zone, which is an area known to be more vulnerable due to chromium depletion during welding. The corrosion pattern was consistent with microbiologically influenced corrosion (MIC), especially given that the damage occurred within the first year of operation. Figure 3 shows a small, magnified piece of the 304L stainless steel pipe where pitting was observed.
Figure 3: Signs of pitting and pipe corrosion in the 304L stainless steel pipes. (Image credit: CPI Engineering)
Chemical testing showed that the pH inside the pits was 6.1, lower than the surrounding water, further supporting the hypothesis of microbial corrosion. Deposits in the pits contained over 4,000 ppm of chloride and 2,800 ppm of sulfate, along with smaller amounts of formate, fluoride, bromide, nitrate, and acetate. The elevated chloride levels suggest accumulation at corrosion sites, possibly influenced by chloride in the greensand effluent due to the higher levels found in the source water or operational practices, such as chemical dosing. Chloride levels this high likely exacerbated the corrosion that began due to MIC.
The project team considered several contributing factors to the elevated chloride levels. Although disinfection was performed before startup, a question was raised whether excessive sodium hypochlorite may have been used. The greensand effluent had a chloride concentration of 130 ppm, which, according to CPI Engineering, is below the threshold where pitting typically occurs (typically around 300 ppm at this temperature and pH). This suggests that excessive hypochlorite dosing was unlikely to be the primary source of the elevated chloride. Instead, the accumulation of chloride within the affected piping is more plausibly attributed to water stagnation in the media fill and removal lines.
To resolve the issue, the pipes were patched while discussions were ongoing with the filter vendor. Ultimately, the pipes were replaced with an alternative material, more resistant to corrosion. Non-metallic materials were initially considered but were rejected as pressure ratings were not sufficient. In addition, ceramic-lined ductile iron and other more noble metals were considered but found to be too costly. The filter system vendor was forthcoming and was willing to work with the District to solve the problem. The final solution to prevent further issues involved the filter vendor supplying schedule 40 316 stainless steel piping, which is less susceptible to corrosion and pitting, to replace all schedule 10 304L stainless steel.
Media Life As mentioned earlier, the District elected to go with the full-scale pilot test of the GAC media and forgo the pilot testing to save capital costs and provide treatment as soon as possible for their customers. During the full-scale operation, it was determined that PFAS was moving through the column relatively quickly. For example, the GAC treated about 20,000 bed volumes (BVs) before the lead filter was exhausted, a shorter bed life than anticipated. Speculation about potential reasons for the shorter bed life included:
There was a long delay as the contractor started up the GAC filters. The manufacturer of the filter pressure vessel recommended that the filter be backwashed each time prior to the filter starting, which was done several times over a three-month period. It was speculated that the backwash water which contained PFAS may have disrupted the mass transfer zone (MTZ) in the media. Going forward, the District plans to forward-flush water through the GAC to keep it fresh, limit biogrowth issues, and maintain the MTZ after the initial backwash.
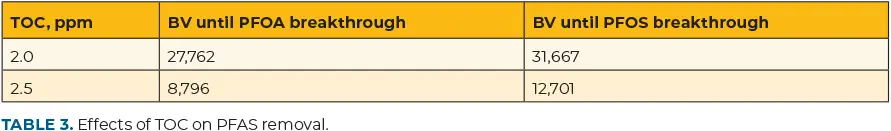
The greensand filter effluent contained TOC values that ranged from 2.0 to 2.5 ppm. This likely competed with PFAS for adsorption sites within the media. In 2024, US EPA issued a guidance document1 which provided simplistic power models for PFAS removal. Table 3 shows the effect of TOC on PFOA and PFOS removal.
Code changes. During the design phase of the project, the most stringent PFAS regulations were the MassDEP’s maximum contaminant level (MCL) of 20 ppt for PFAS6. Shortly after construction was completed, the US EPA finalized its own MCLs for PFAS in drinking water, which were much more stringent than the PFAS6 MCL. Though the EPA’s MCL has still not gone into effect, the District maintained its proactive stance and changed its monitoring protocol for PFAS. This in turn led to reduced media life, since the media would need to be replaced when PFOA and/or PFOS approached 4 ppt, rather than 10 ppt for the PFAS6 as stated in the MassDEP permit.
This is Not the End
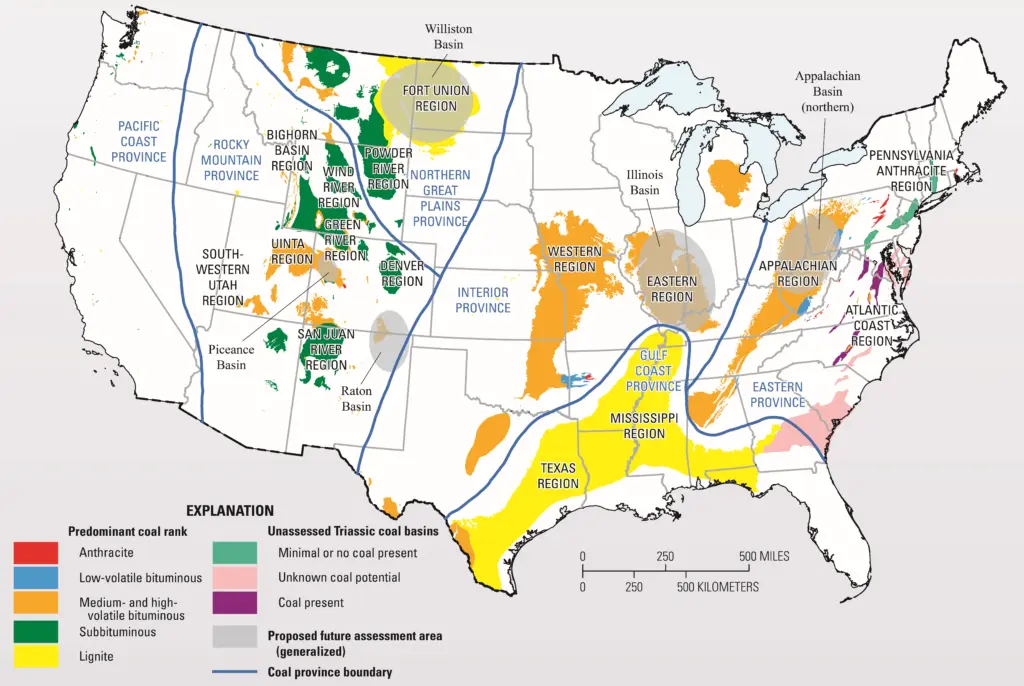
Undeterred, the District immediately coordinated with MassDEP to start the process of developing bid documents for a three-year bituminous, reagglomerated GAC bid contract. The process required several reviews by MassDEP which, after about two months, approved the District’s standard operating procedure. The District elected to stay with bituminous coal since this is the most commonly accepted media under the new technology list, could easily be found domestically (Figure 4), and has a good track record for PFAS removal.
Figure 4: Major coal sources in the United States2 (Image credit: U.S. Geological Survey)
The bid documents included requirements for the media to be regenerated by the vendor for future reuse in a National Sanitary Foundation (NSF)-approved facility. The vendor was also required to keep the GAC separate from other GAC that could be used for non-potable purposes. The regenerated media was also to be held in storage in tagged bags until the media was reused at the Raymond Road WTP.
The regeneration of GAC using a gas-fired, multi-hearth Herreschoff furnace showed promise in effectively destroying PFAS that had been adsorbed to the GAC3,4. The overall PFAS abatement system for this process consists of a three-stage, direct-fire, thermal oxidizer followed by a spray quench cooler, dry injection scrubber, a baghouse for particulate removal, and a stack.
Figure 5: The insulated fabric building constructed to house the GAC filters.
GAC typically has some issues at startup, one common one being that GAC can exhibit a short-term effect where it will exchange for hydrogen protons, briefly raising the pH. Once exhausted, however, the pH in and out of the filter are similar. Also, depending on where the coal was mined, GAC can have residual metals that need to be washed out of the media during startup.
During initial backwashing and conditioning, granular activated carbon (GAC) can leach trace metals. At startup of the new vendor-supplied media, arsenic – regulated with a drinking water MCL of 10 ppb – was detected in the wash water at concentrations ranging from 12 to 18 ppb until adequately flushed
To address this issue and not cause another unintended one, backwash water was disposed of in the District’s concrete lined lagoons where arsenic can associate with the iron and manganese residuals and be properly disposed of in a municipal solid waste landfill. Once the arsenic levels in the filter effluent were below 10 ppb, the filter was placed online for production.
A Fairy Tale Ending?
Providing the highest quality water at a reasonable price has always been the District’s goal. When they began sampling for PFAS early and understood that they likely would have levels above the proposed limits, they took action, understanding that this was in the best interest of their water customers.
Taking this early action allowed the District to take advantage of lower construction costs due to being in front of the many PFAS facilities that would be installed in the near further. Early action also allowed them to avail themselves of state revolving loan funds (SRF) before the rush of other applicants. Finally, full-scale pilot testing of a generally accepted treatment process saved them the added costs of conducting a smaller scale pilot test.
At the time of treatment analysis, it was unknown how long PFAS would be an environmental issue since manufacturing processes were moving away from using PFAS compounds. Instead of investing in an expensive concrete masonry unit (CMU) building or other similar structure, the District elected to implement an insulated fabric building (Figure 5) which reduced the overall cost of the project and allowed them to size the system for current day demands. The design of the building and its foundation will allow it to be repurposed in later years for other uses should PFAS no longer be a major contamination issue.
Following construction of the PFAS treatment system at the Raymond Road WTP, Weston & Sampson then worked hand in hand with the District to integrate PFAS treatment into their East Street WTP and began looking into the feasibility of treating two other source wells. The East Street WTP PFAS treatment system is expected to go online in 2026.
The District has always held a proactive position in addressing the water quality they provide to their customers. Addressing PFAS is just another example of their commitment to providing safe water.
Authors
Sara Guglielmi, PE Weston & Sampson 55 Walkers Brook Drive, Suite 100 Reading, MA 01867 978.532.1900 guglielmi.sara@wseinc.com
Andy Reid, PE, BCEE Weston & Sampson 55 Walkers Brook Drive, Suite 100 Reading, MA 01867 978.532.1900 reid.andrew@wseinc.com
Vincent Roy Sudbury Water District 199 Raymond Road Sudbury, MA 01776 978.443.6602 vroy@sudburywater.com
References
Technologies and Costs for Removing Per- and Polyfluoroalkyl Substances (PFAS) from Drinking Water. U.S. Environmental Protection Agency, EPA Document No. EPA-815R24012, March 2024.
Thermal Destruction of PFAS During Full-Scale Reactivation of PFAS-Laden Granular Activated Carbon. DiStefano, R., Feliciano, T., Minna, R.A., Redding, A.M., Mathis, J. First published Sept. 13, 2022. https://doi.org/10.1002/rem.21735